 Kdeplot
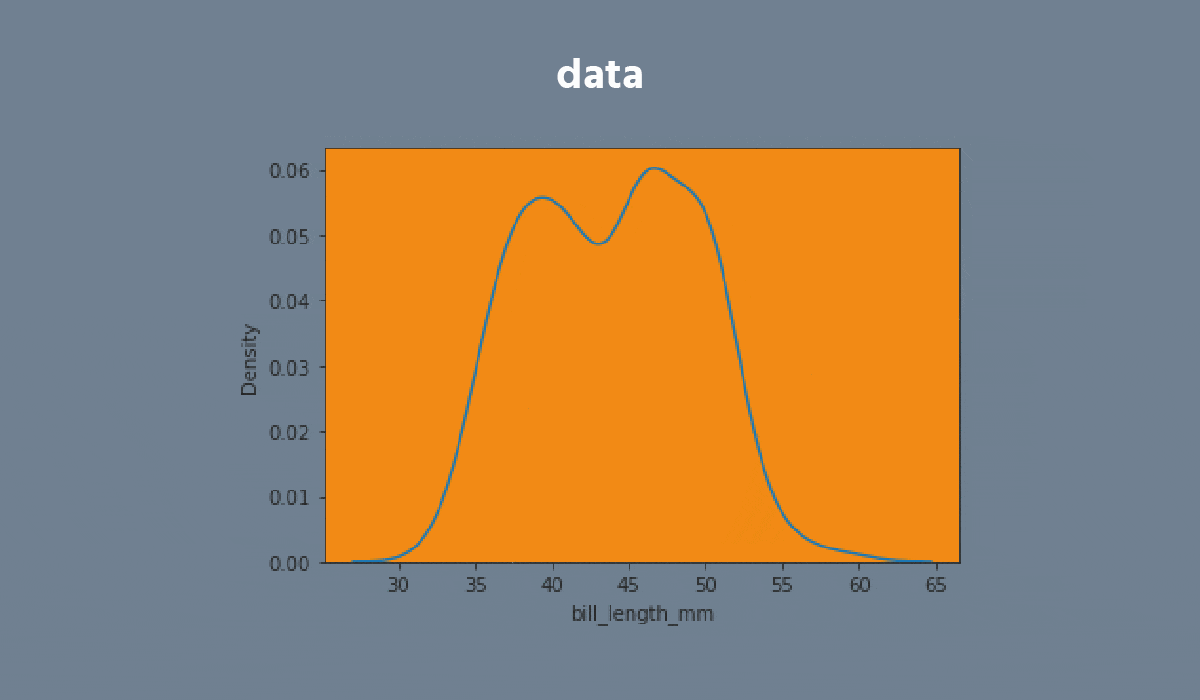
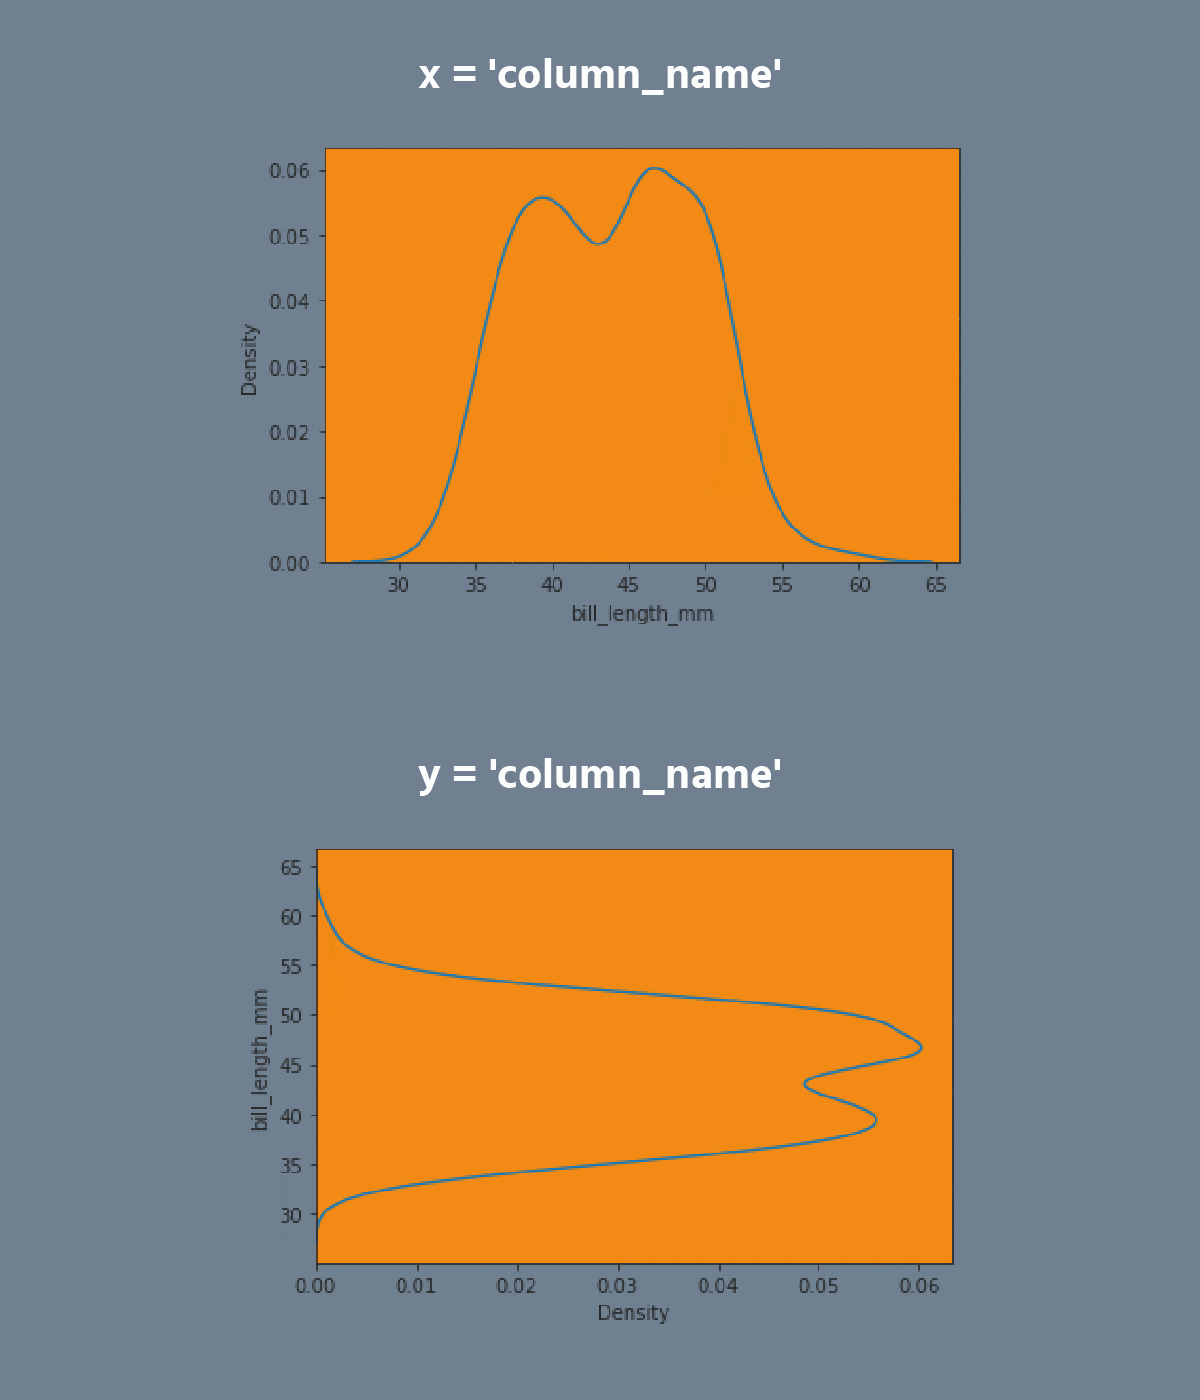
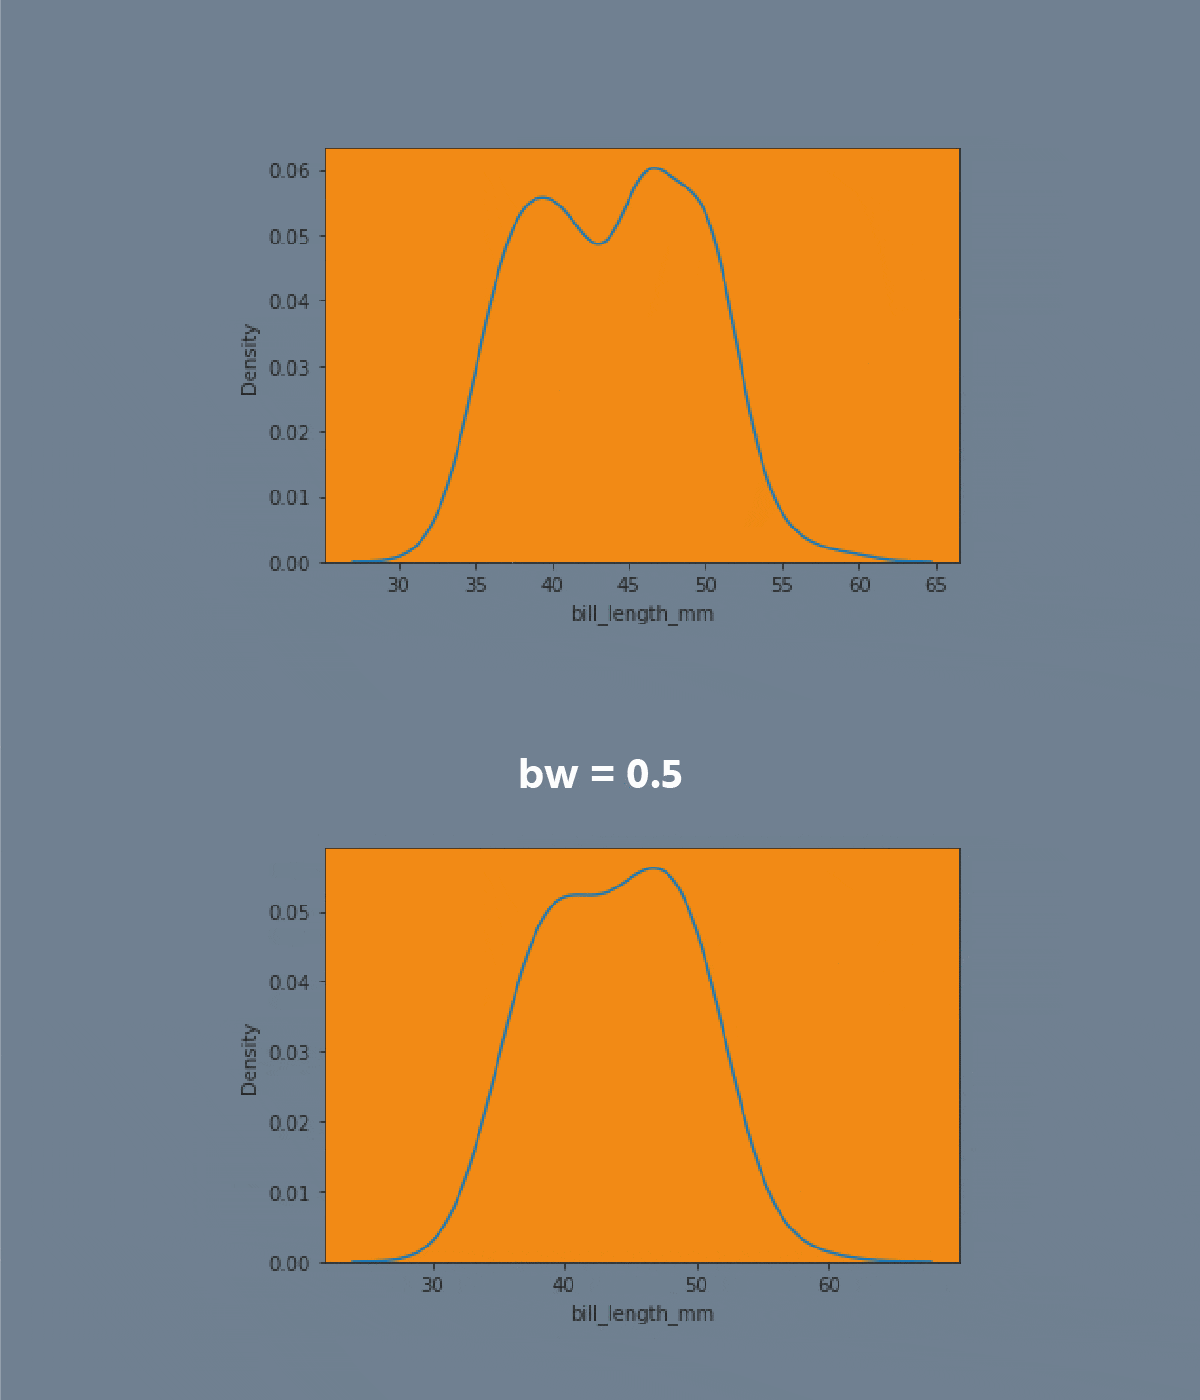
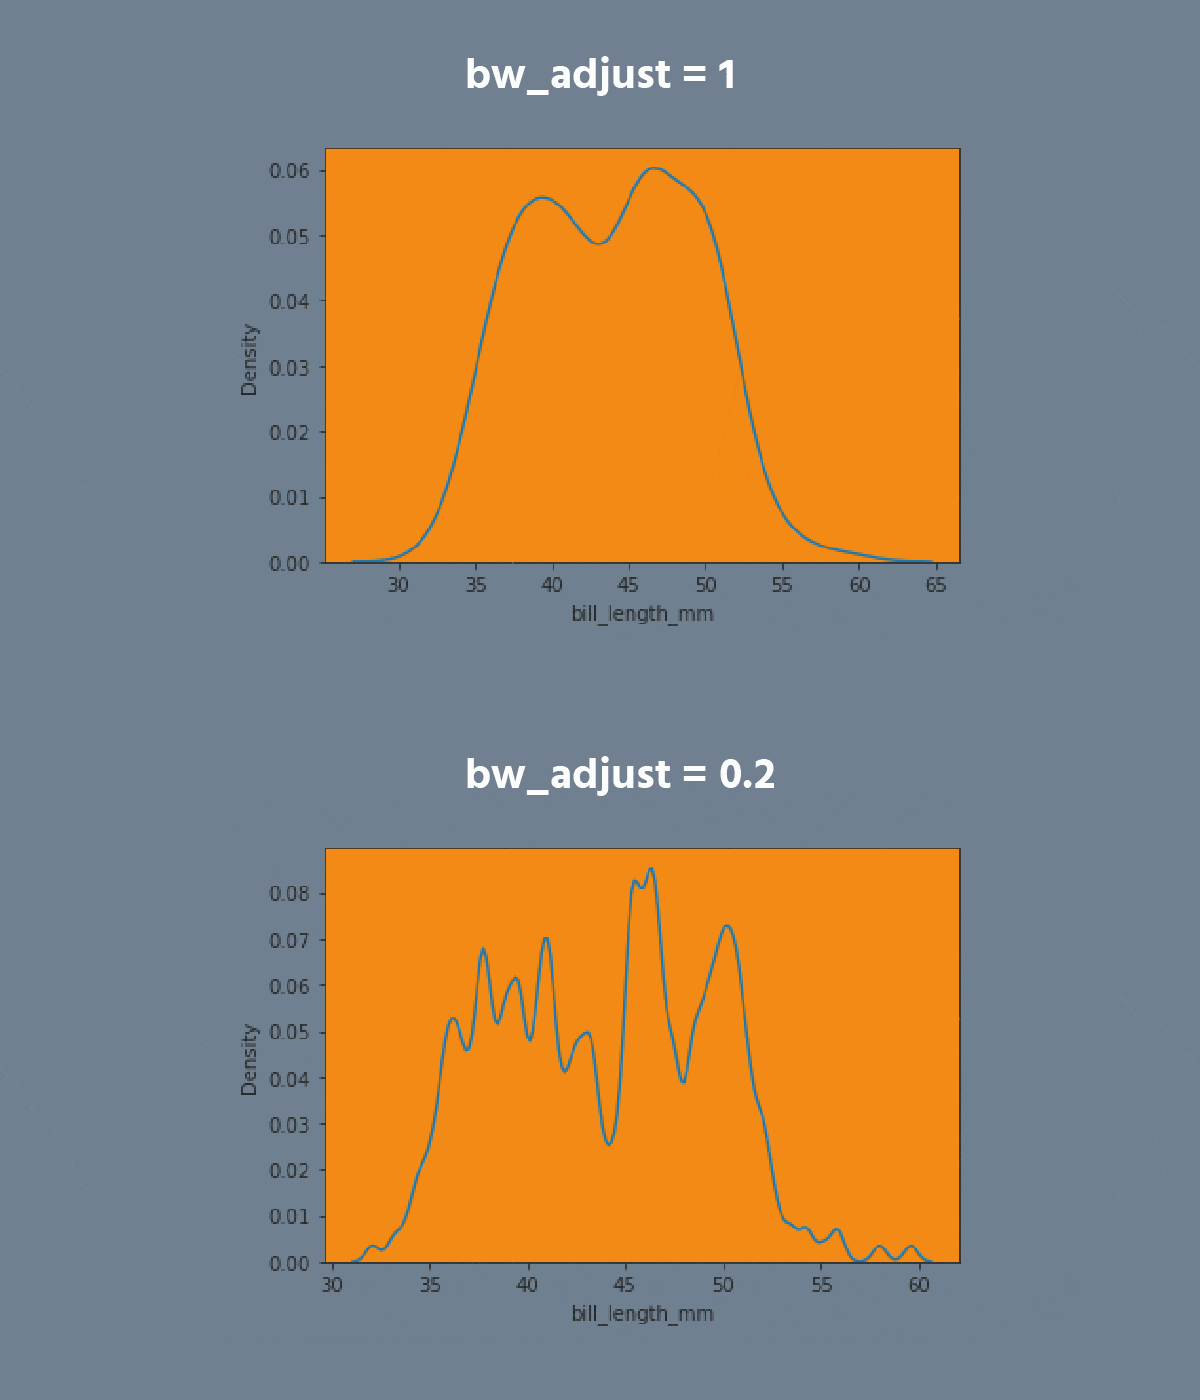
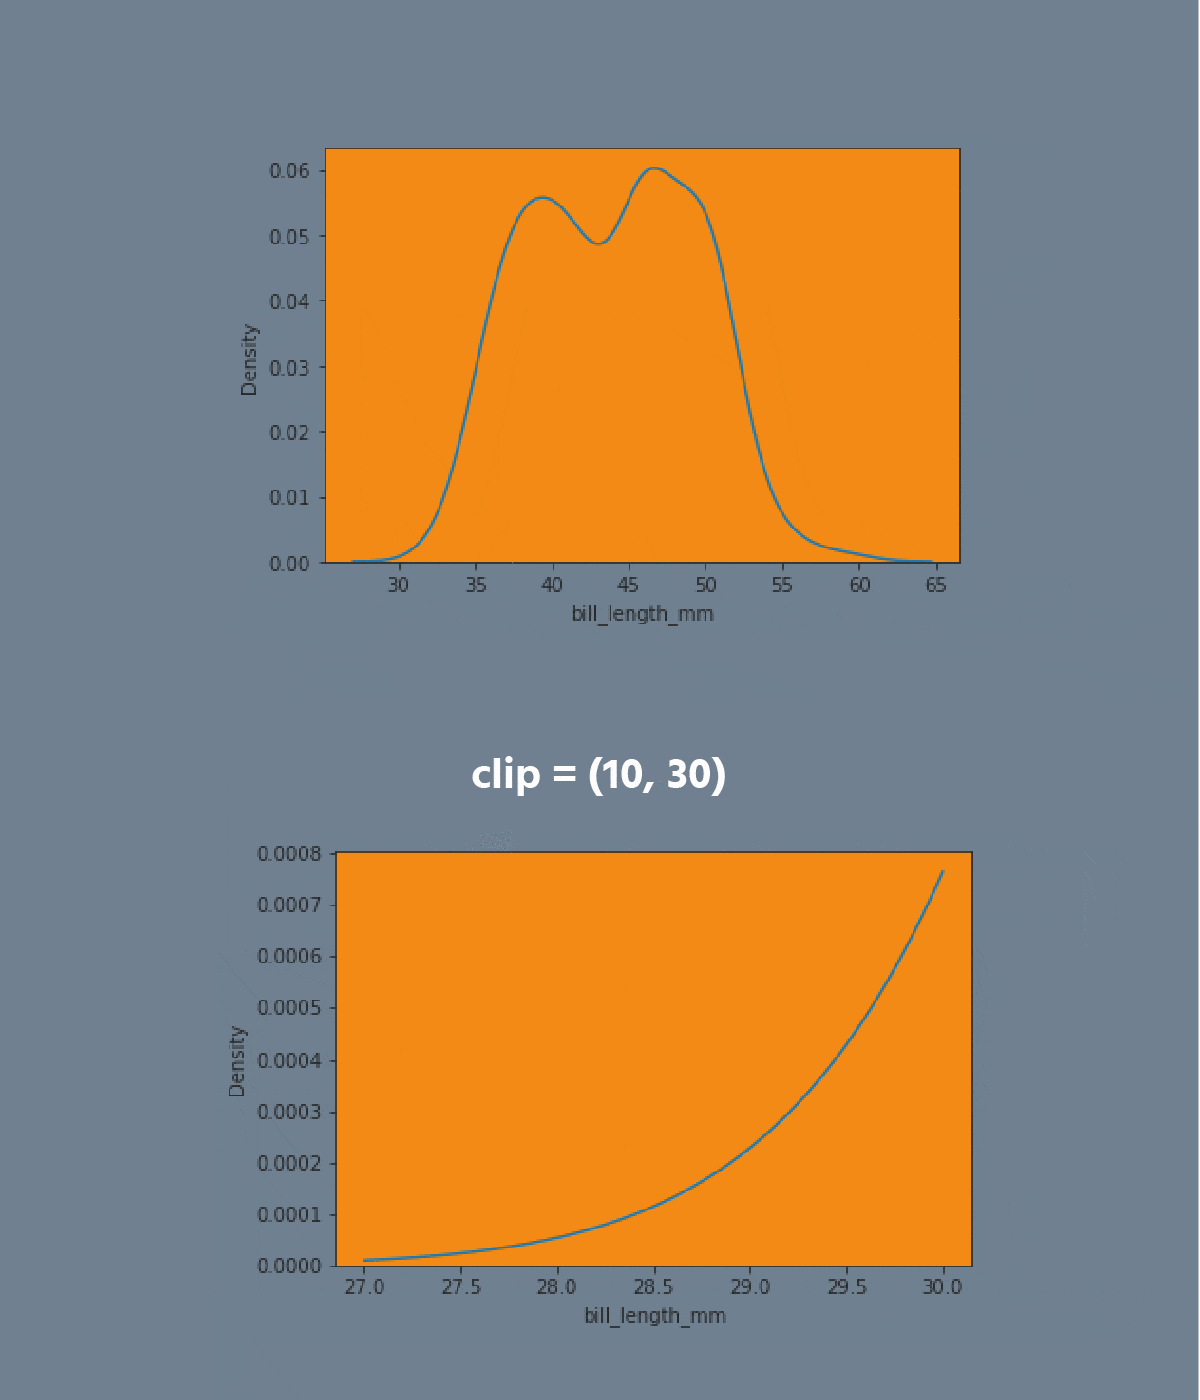
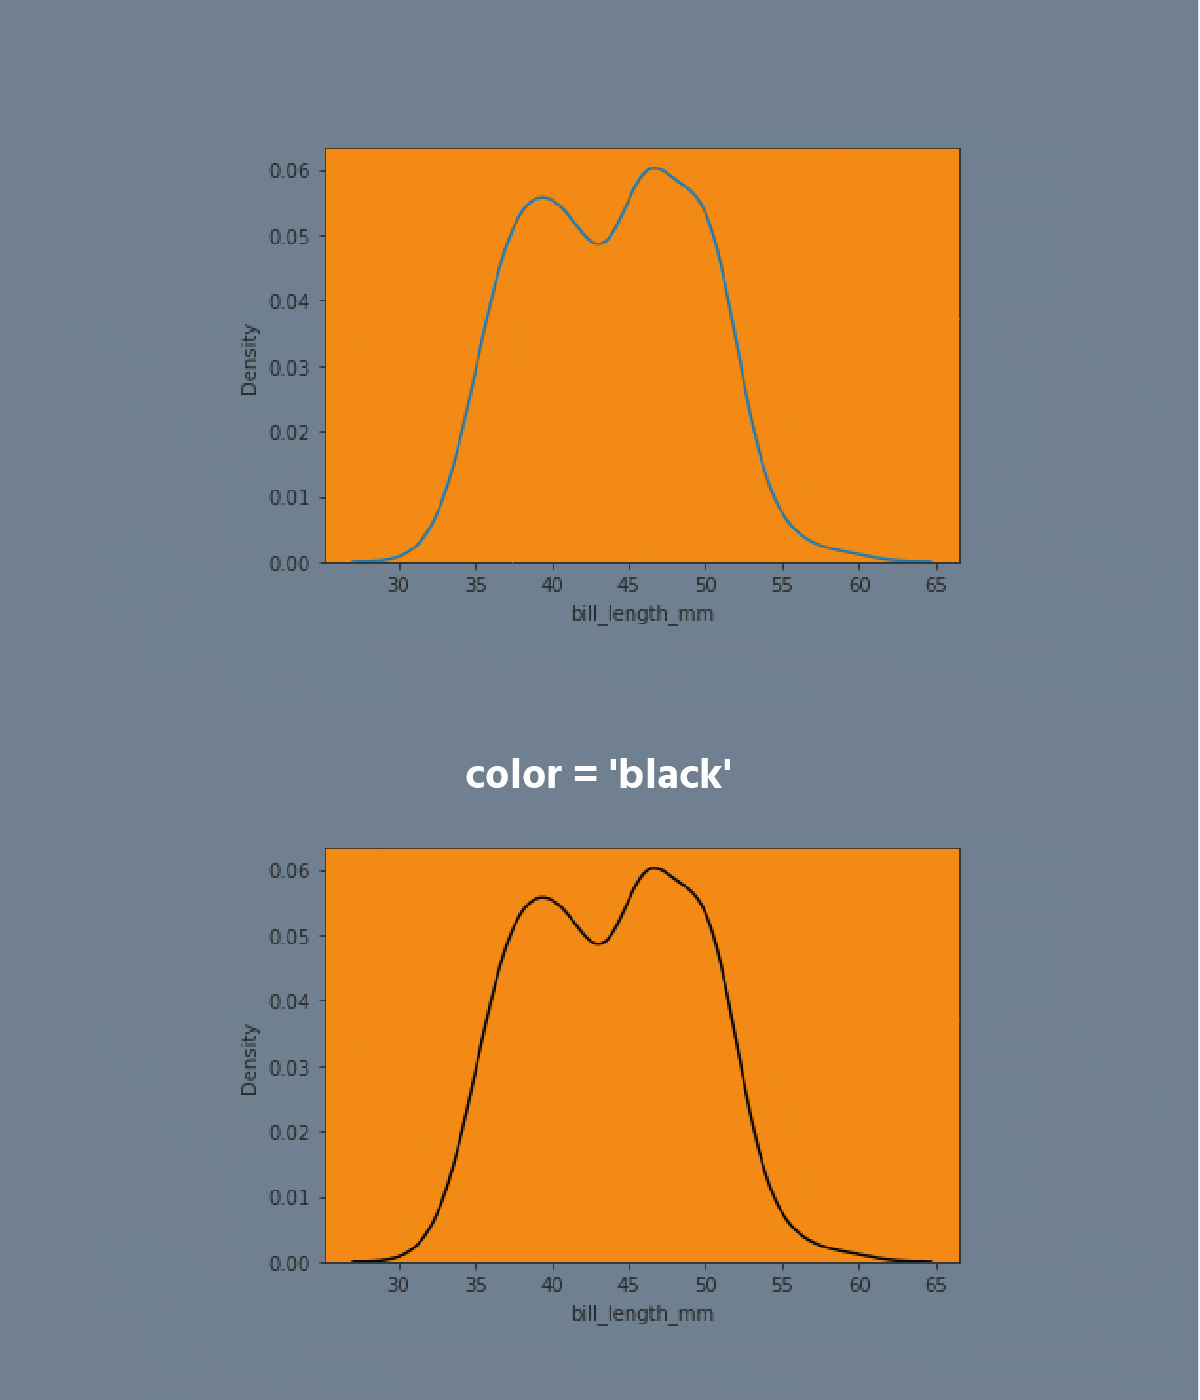
A kdeplot plot is a method for visualizing the distribution of observations in a dataset analogous to a histogram. KDE represents the data using a continuous probability density curve in one or more dimensions.




Opgave
Swipe to start coding
- Create the kdeplot using the
seabornlibrary:
- Set the
xparameter equals the'max_temp'; - Set the
hueparameter equals the'month'; - Set the
multipleparameter equals the'stack'; - Disable the
legend; - Add the filling;
- Set the data;
- Display the plot.
Løsning
Var alt klart?
Tak for dine kommentarer!
Sektion 2. Kapitel 2
single
Spørg AI
Spørg AI

Spørg om hvad som helst eller prøv et af de foreslåede spørgsmål for at starte vores chat

Fantastisk!
Completion rate forbedret til 4.35 Kdeplot
Stryg for at vise menuen
A kdeplot plot is a method for visualizing the distribution of observations in a dataset analogous to a histogram. KDE represents the data using a continuous probability density curve in one or more dimensions.


Opgave
Swipe to start coding
- Create the kdeplot using the
seabornlibrary:
- Set the
xparameter equals the'max_temp'; - Set the
hueparameter equals the'month'; - Set the
multipleparameter equals the'stack'; - Disable the
legend; - Add the filling;
- Set the data;
- Display the plot.
Løsning
Var alt klart?
Tak for dine kommentarer!
Sektion 2. Kapitel 2
single