 Histplot
The distributions module contains several functions designed to answer questions such as these. The axes-level functions are histplot, kdeplot, ecdfplot, and rugplot. They are grouped together within the figure-level displot function.
A histplot is a classic visualization tool that represents the distribution of one or more variables by counting the number of observations that fall within discrete bins.
Click the slider to view possible arguments for the plot!
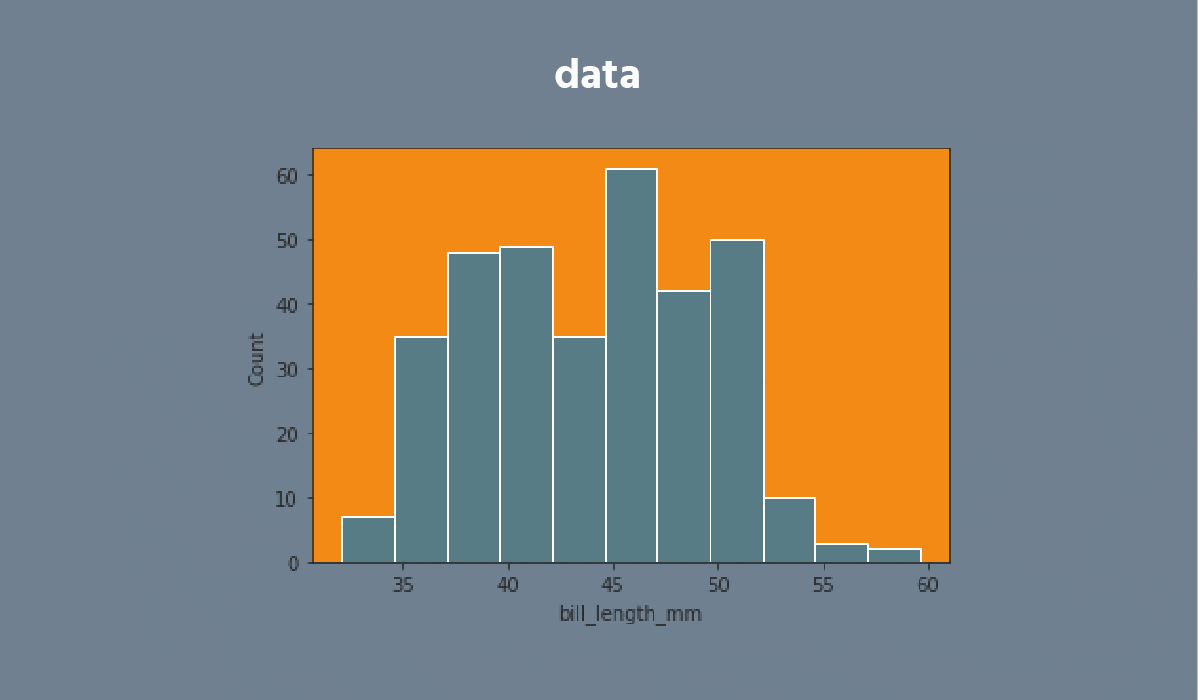


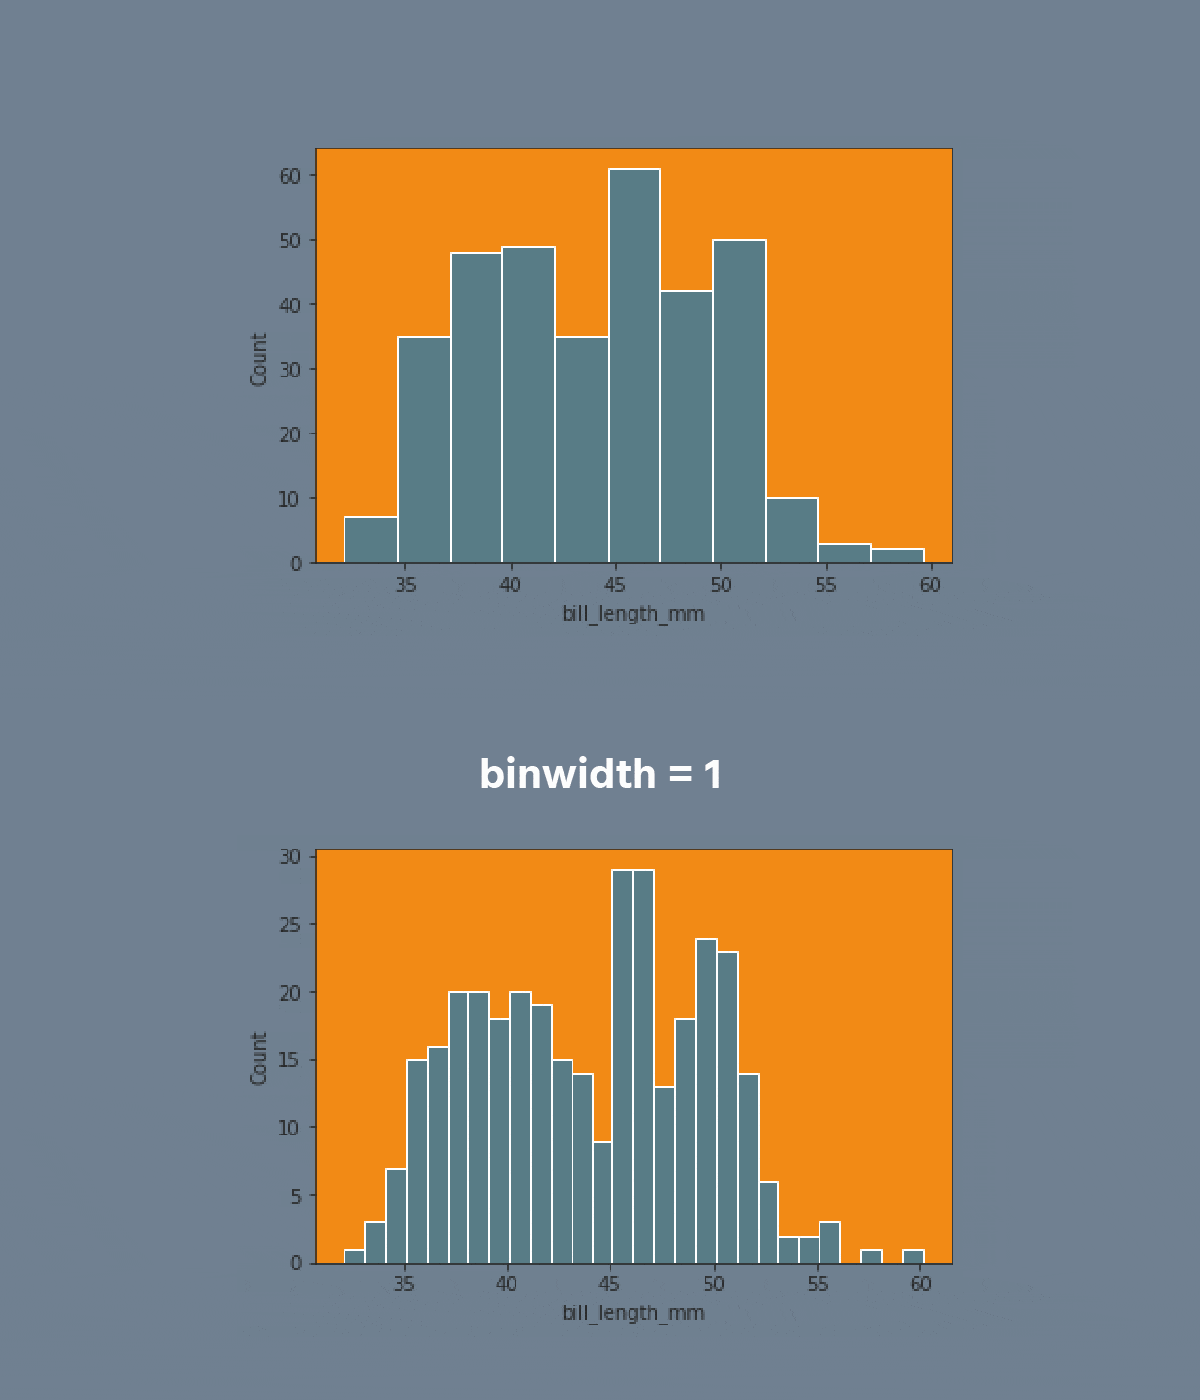


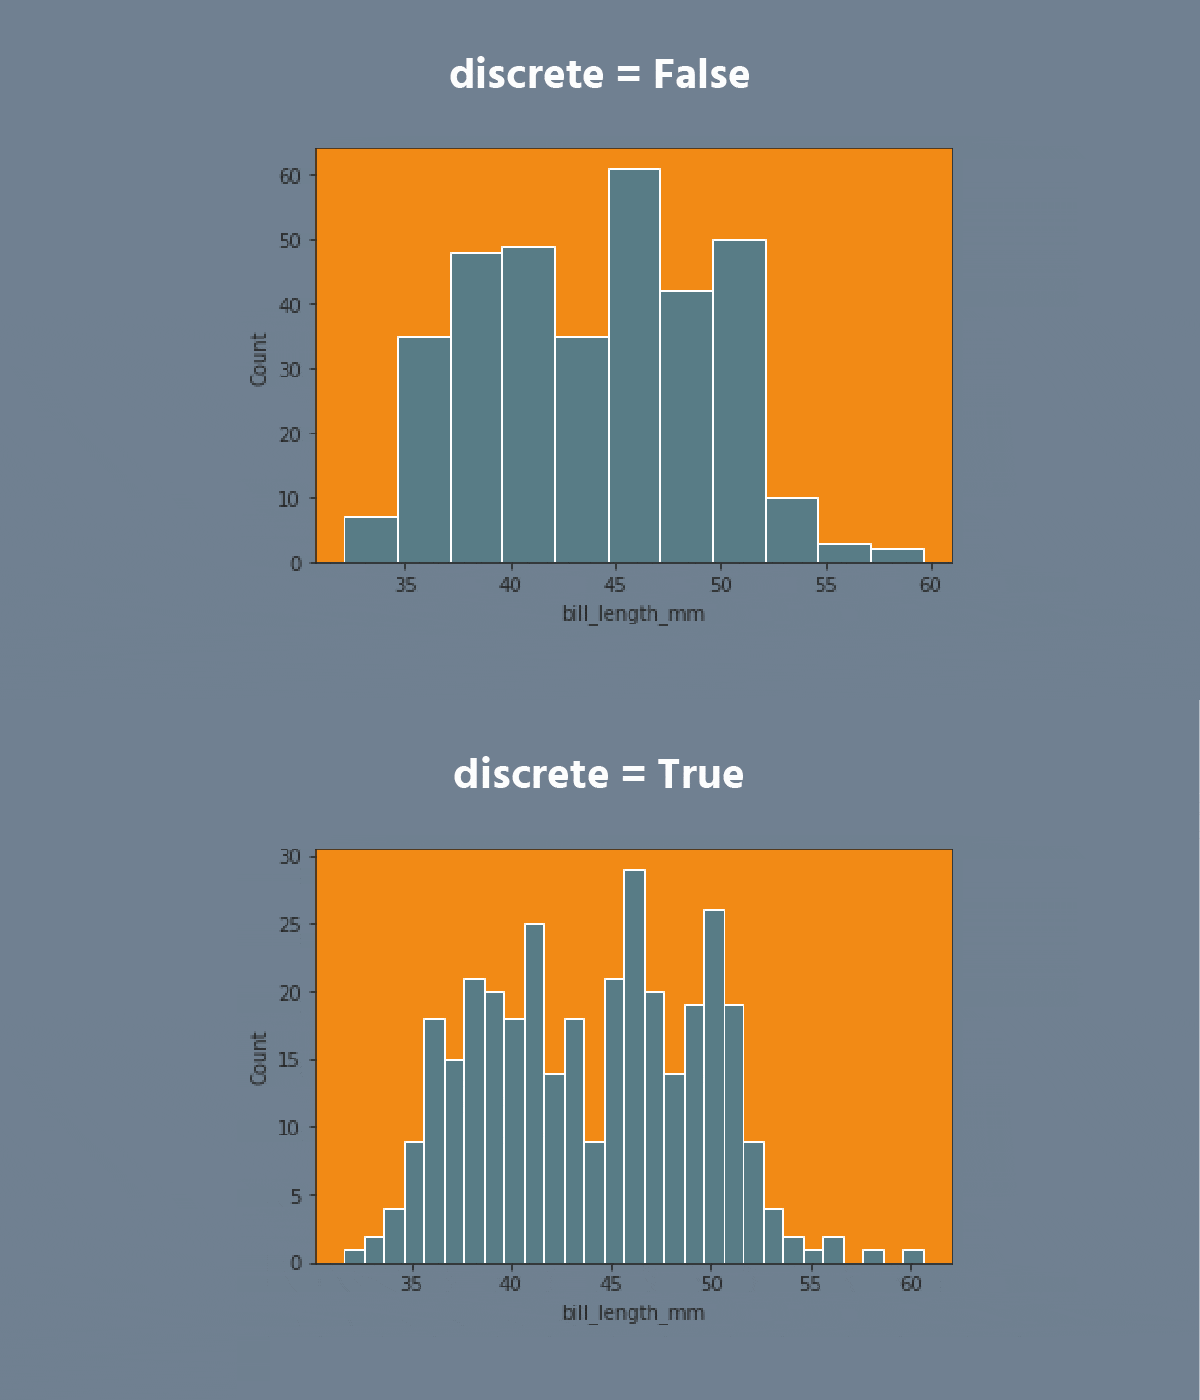
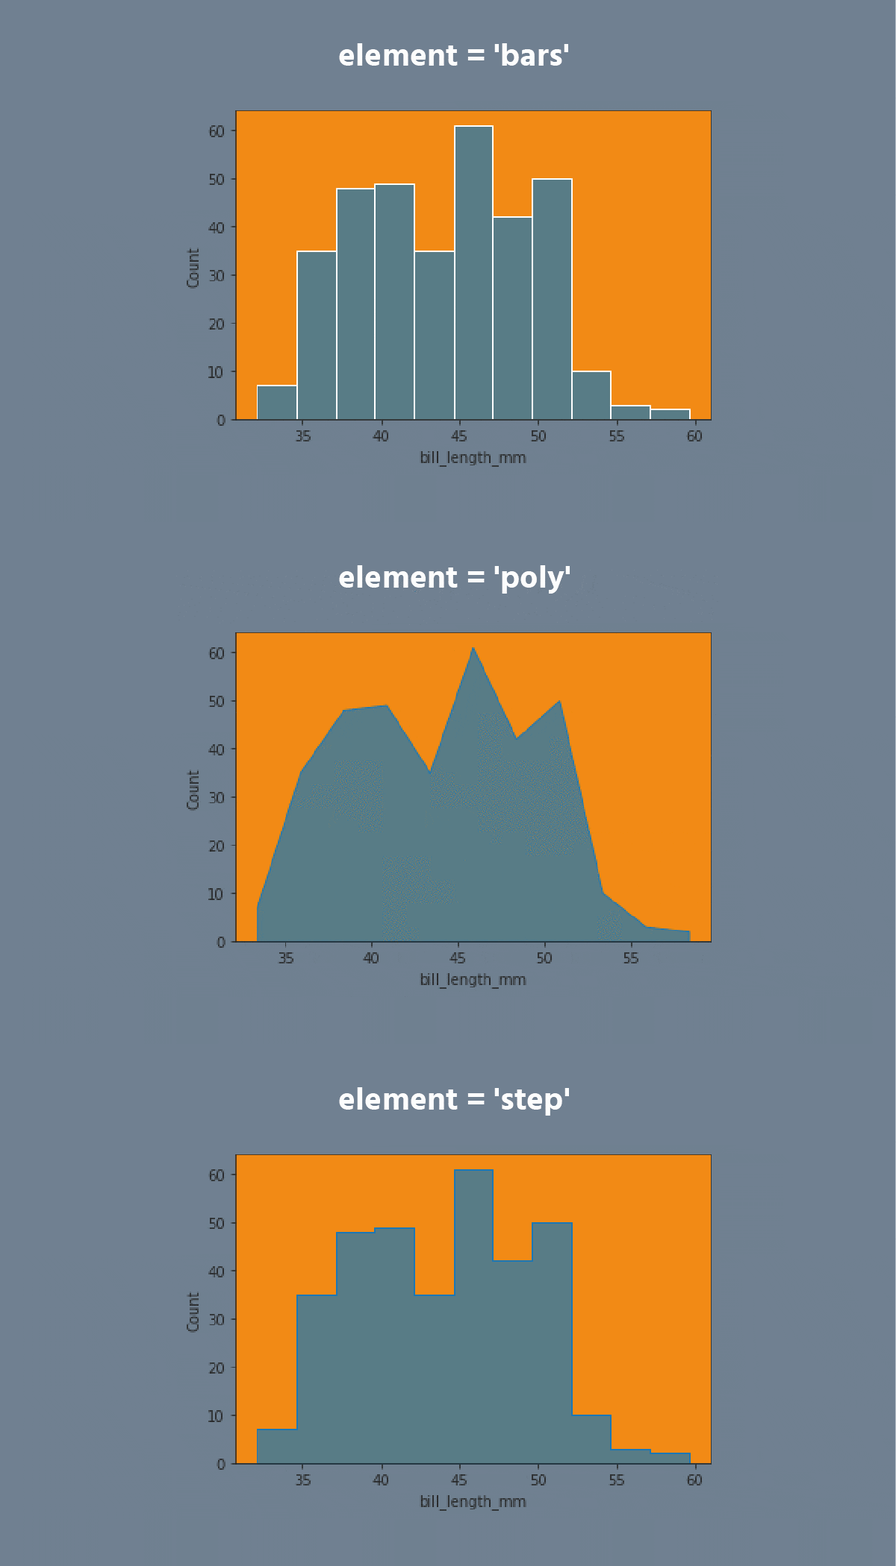


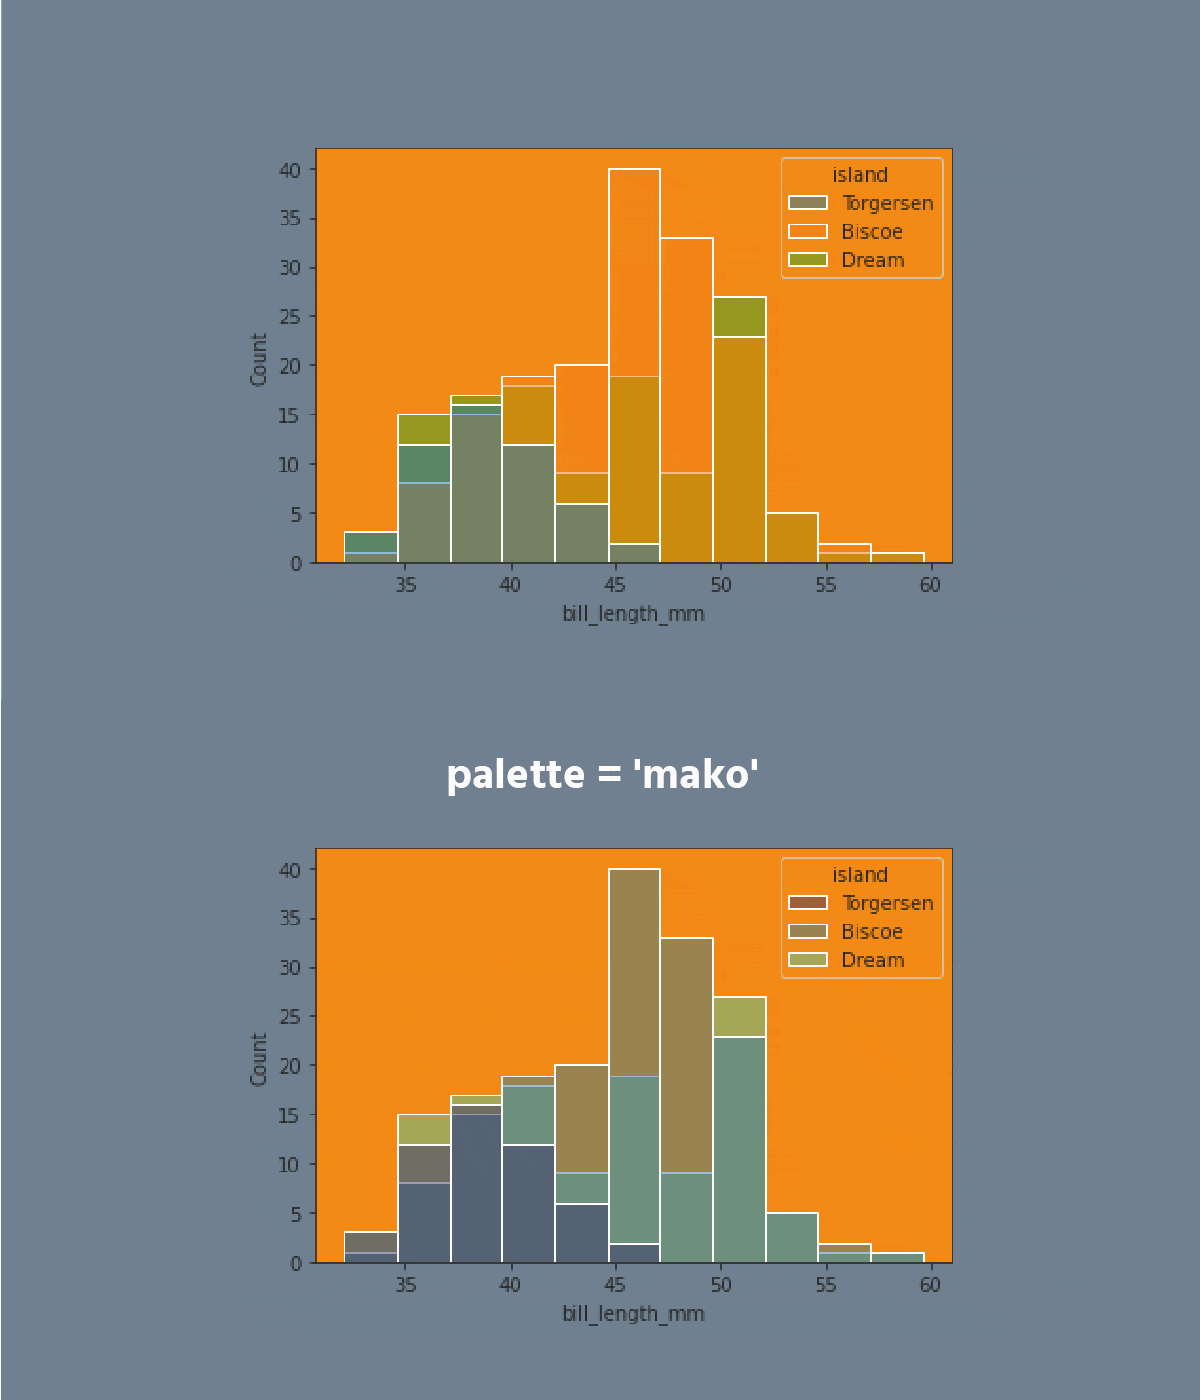
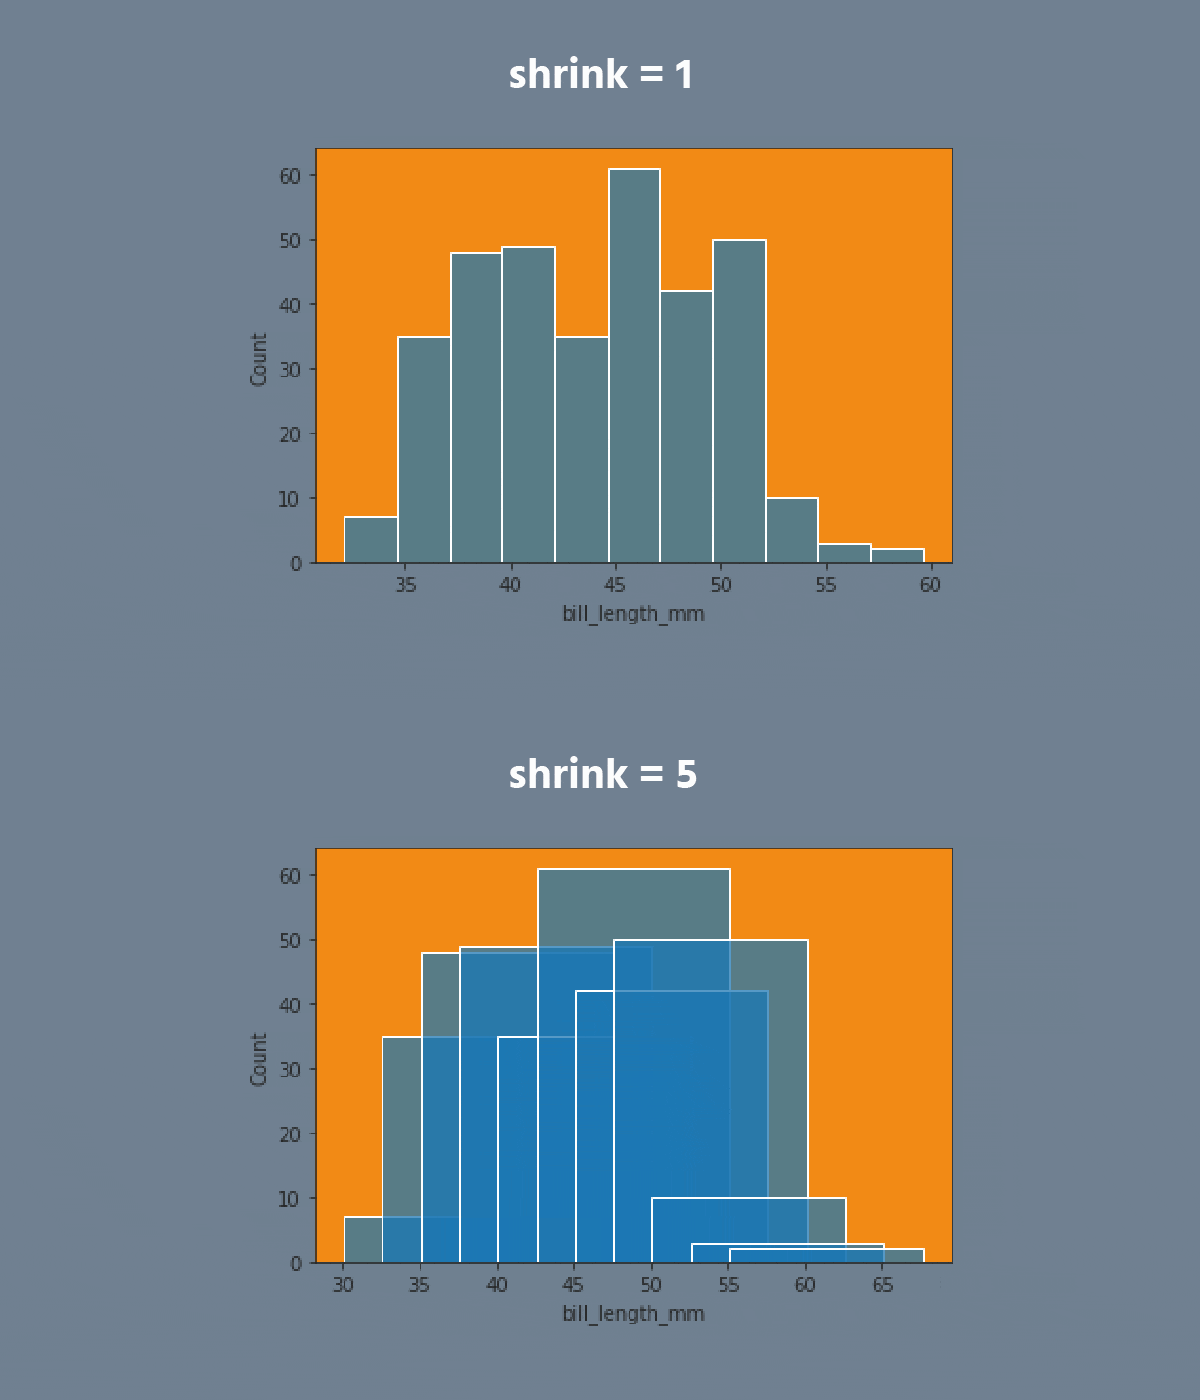

Don't forget to return back after exploring the dataset!
Note
Use
plt.show()to display the plot.
Swipe to start coding
- Create the histplot using the
seabornlibrary:
- Set the
xparameter equals the'bill_length_mm'; - Set the
hueparameter equals the'island'; - Set the
elementparameter equals the'step'; - Set the
statparameter equals the'density'; - Set the
binwidthparameter equals1; - Set the
'flare'palette; - Use the
dfdata for the plot; - Display the plot.
Lösung
Danke für Ihr Feedback!
single
Fragen Sie AI
Fragen Sie AI

Fragen Sie alles oder probieren Sie eine der vorgeschlagenen Fragen, um unser Gespräch zu beginnen

Großartig!
Completion Rate verbessert auf 4.35 Histplot
Swipe um das Menü anzuzeigen
The distributions module contains several functions designed to answer questions such as these. The axes-level functions are histplot, kdeplot, ecdfplot, and rugplot. They are grouped together within the figure-level displot function.
A histplot is a classic visualization tool that represents the distribution of one or more variables by counting the number of observations that fall within discrete bins.
Click the slider to view possible arguments for the plot!


Don't forget to return back after exploring the dataset!
Note
Use
plt.show()to display the plot.
Swipe to start coding
- Create the histplot using the
seabornlibrary:
- Set the
xparameter equals the'bill_length_mm'; - Set the
hueparameter equals the'island'; - Set the
elementparameter equals the'step'; - Set the
statparameter equals the'density'; - Set the
binwidthparameter equals1; - Set the
'flare'palette; - Use the
dfdata for the plot; - Display the plot.
Lösung
Danke für Ihr Feedback!
single