 Kdeplot
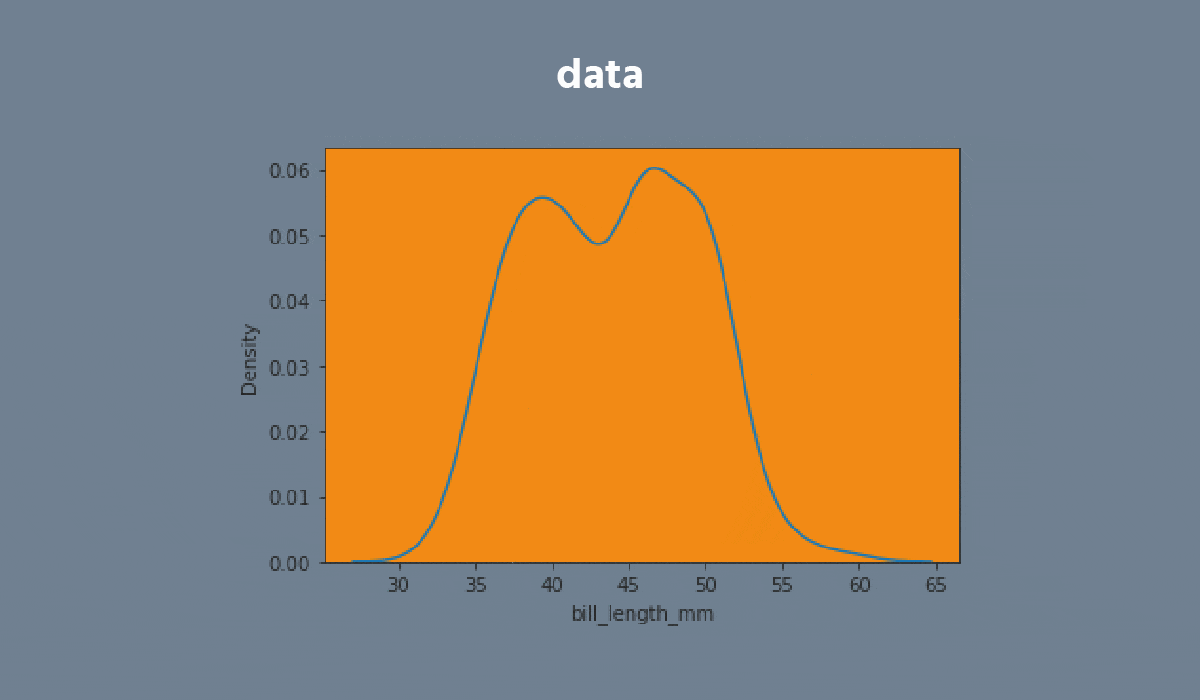
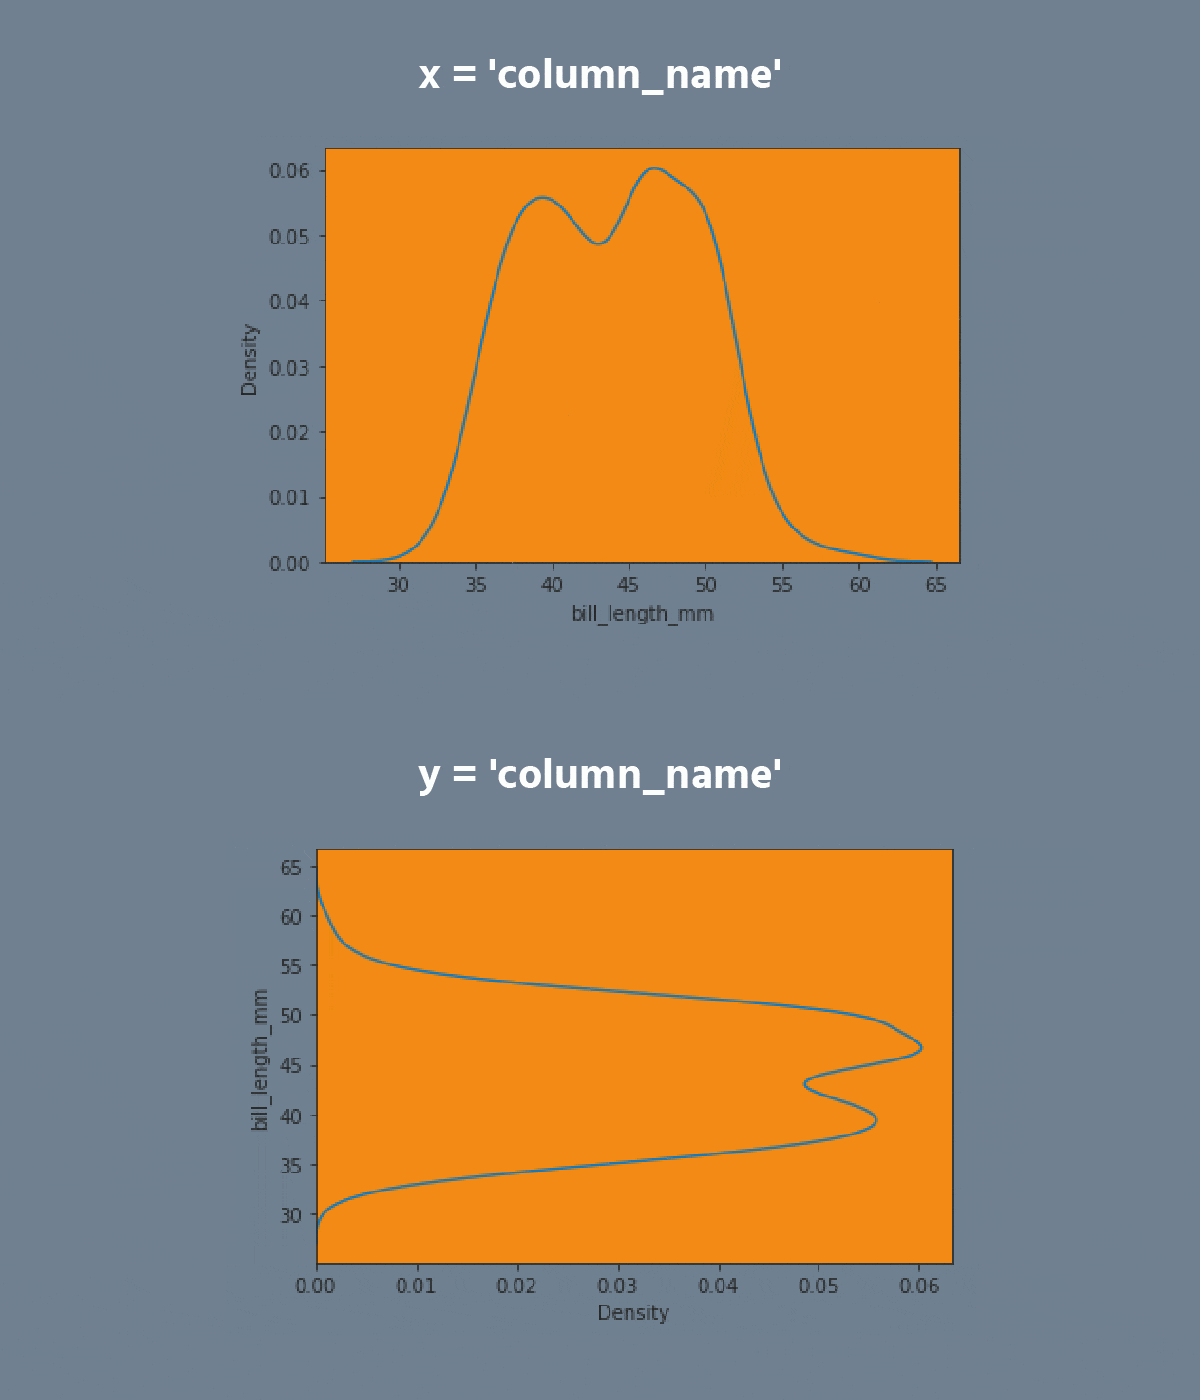
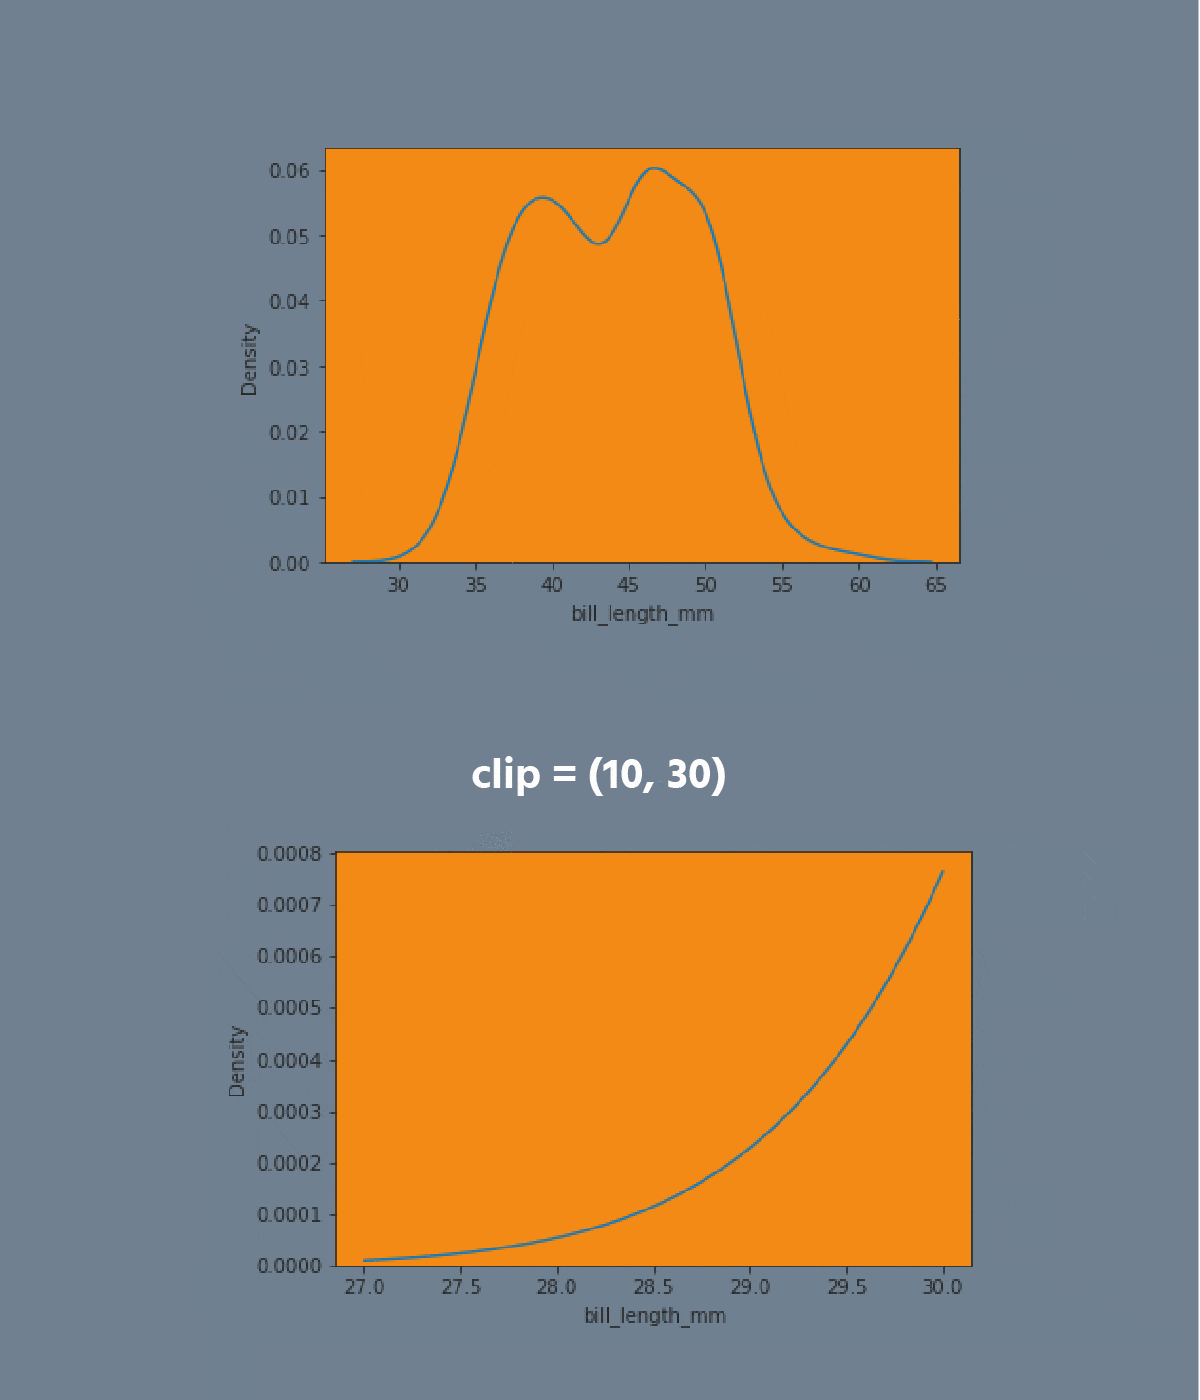
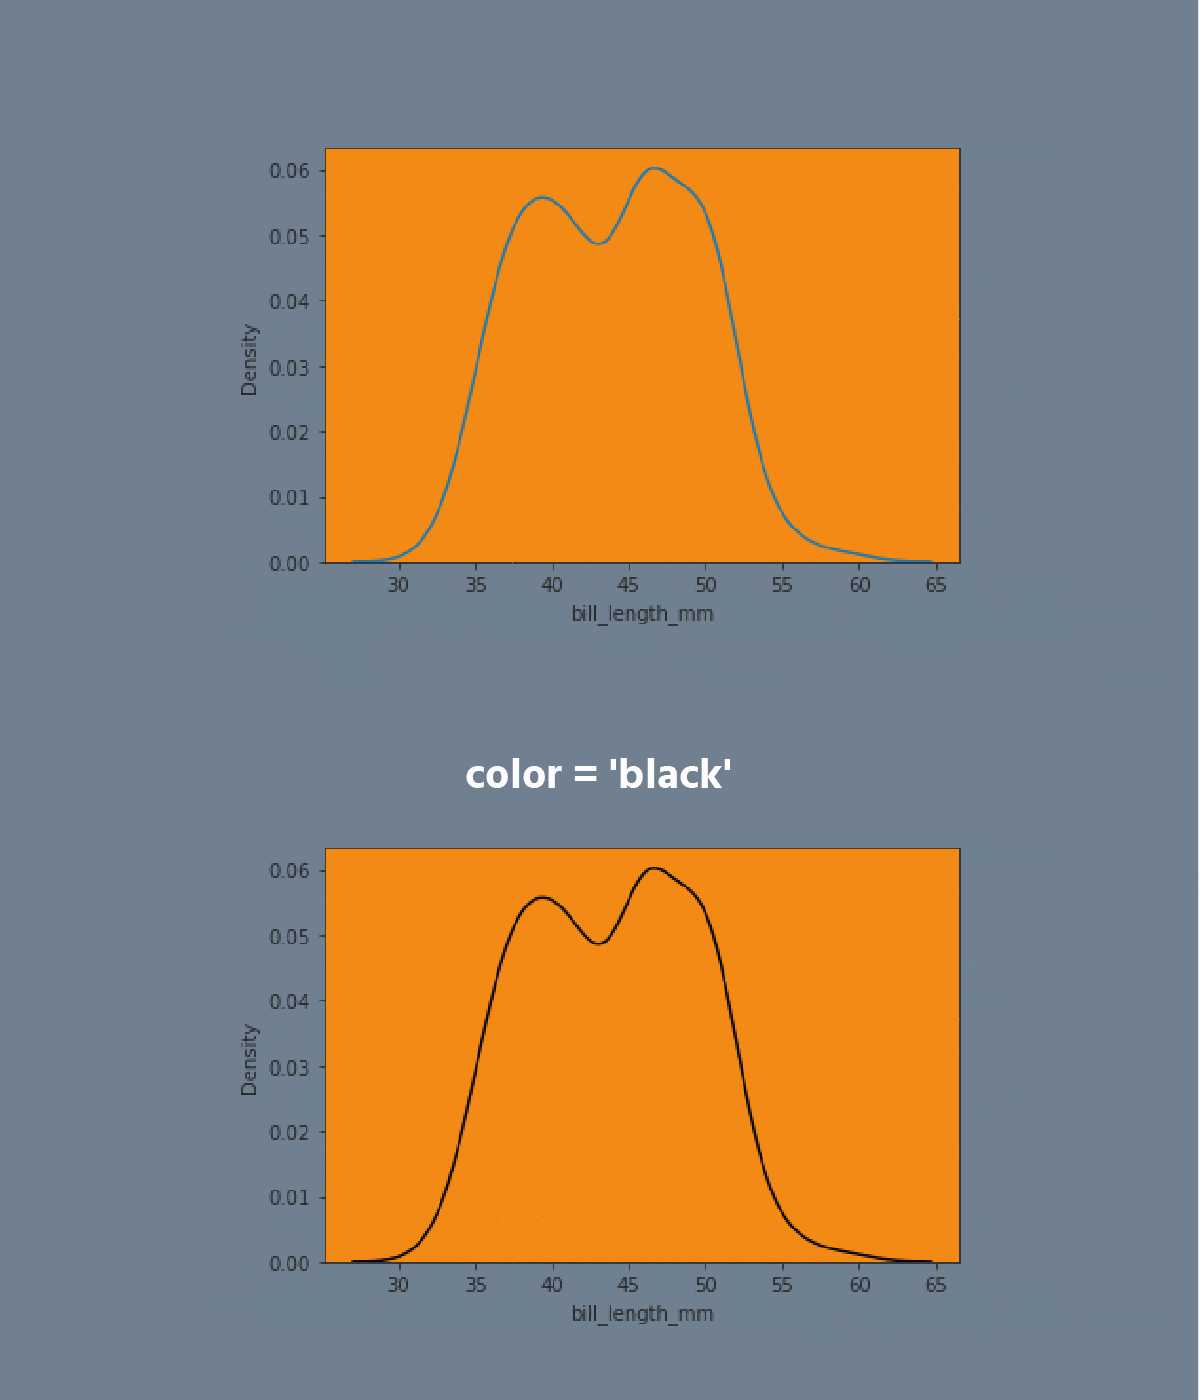
A kdeplot plot is a method for visualizing the distribution of observations in a dataset analogous to a histogram. KDE represents the data using a continuous probability density curve in one or more dimensions.




Aufgabe
Swipe to start coding
- Create the kdeplot using the
seabornlibrary:
- Set the
xparameter equals the'max_temp'; - Set the
hueparameter equals the'month'; - Set the
multipleparameter equals the'stack'; - Disable the
legend; - Add the filling;
- Set the data;
- Display the plot.
Lösung
War alles klar?
Danke für Ihr Feedback!
Abschnitt 2. Kapitel 2
single
Fragen Sie AI
Fragen Sie AI

Fragen Sie alles oder probieren Sie eine der vorgeschlagenen Fragen, um unser Gespräch zu beginnen

Großartig!
Completion Rate verbessert auf 4.35 Kdeplot
Swipe um das Menü anzuzeigen
A kdeplot plot is a method for visualizing the distribution of observations in a dataset analogous to a histogram. KDE represents the data using a continuous probability density curve in one or more dimensions.


Aufgabe
Swipe to start coding
- Create the kdeplot using the
seabornlibrary:
- Set the
xparameter equals the'max_temp'; - Set the
hueparameter equals the'month'; - Set the
multipleparameter equals the'stack'; - Disable the
legend; - Add the filling;
- Set the data;
- Display the plot.
Lösung
War alles klar?
Danke für Ihr Feedback!
Abschnitt 2. Kapitel 2
single