Notice: This page requires JavaScript to function properly.
Please enable JavaScript in your browser settings or update your browser.
Lernen Entity-Relationship Model | Section
Relational Database Fundamentals

Entity-Relationship Model

Swipe um das Menü anzuzeigen

Databases come in various sizes, comprising different numbers of tables and relationships. This is why we use diagrams when designing databases – they offer a visual representation of the database's structure.

Let's get acquainted with the most commonly used diagram in database design: the entity-relationship model (often abbreviated as ER model). For instance:
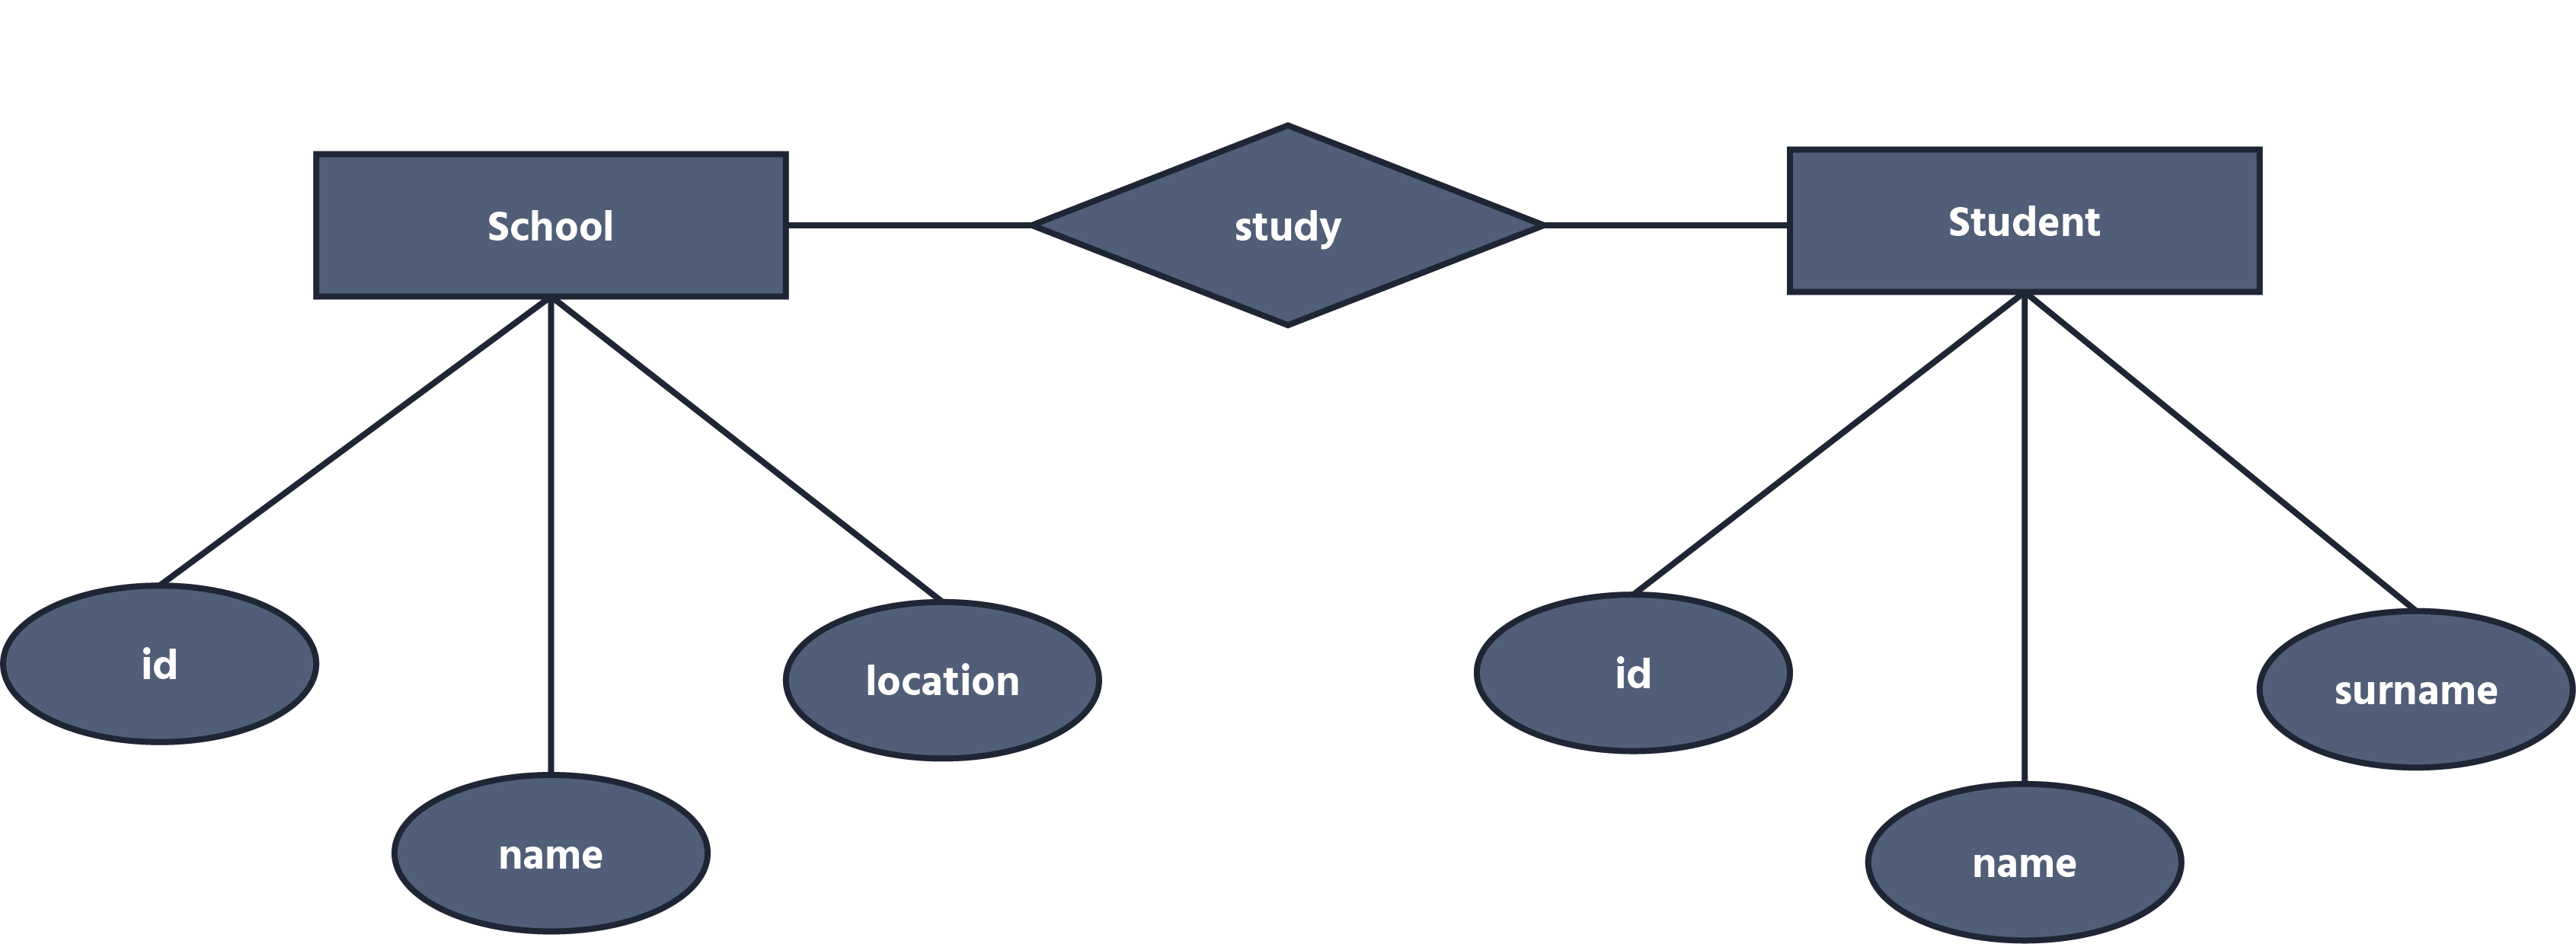
In this example, we have two entities: School and Student. The School entity boasts attributes like id, name, and location, whereas the Student entity features attributes such as id, name, and surname. There exists a relationship between the Student and School entities, which we label as "study".

In tables of relational databases, this can be depicted using a foreign key:
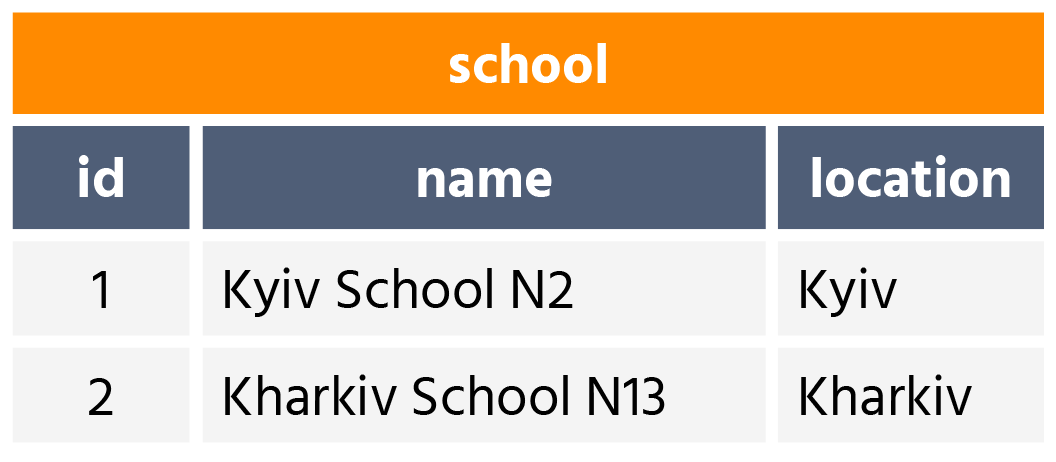
The "study" relationship is captured using a foreign key (the school_id column in this case).

Such models are instrumental in crafting a coherent database structure.

Concepts

The ER model is underpinned by three essential concepts:

  • Entities: These can be tangible or abstract objects, like schools and students. Represented by a Rectangle;

  • Attributes: These are features or properties tied to entities. For instance, a school might have attributes like location or founding year, while a student might have age or group. Represented by an Ellipse;

  • Relationships: These signify the interactions or connections between entities or attributes. Represented by a Rhombus.

You can see the graphical representation of these elements in the image provided:

Modern Entity-Relationship Diagram Presentation

Given that attribute shapes can take up a significant amount of space on a diagram, there's an alternative representation:

In this format, you'll notice a single-column table. The header denotes the entity, while each row below corresponds to the attributes linked to that entity.

question-icon

Choose the shapes:

The Entity shape is .

The Attribute shape is
.

The Relationship shape is
.

Klicken oder ziehen Sie Elemente und füllen Sie die Lücken aus

War alles klar?

Wie können wir es verbessern?

Danke für Ihr Feedback!

Abschnitt 1. Kapitel 3

Fragen Sie AI

expand

Fragen Sie AI

ChatGPT

Fragen Sie alles oder probieren Sie eine der vorgeschlagenen Fragen, um unser Gespräch zu beginnen

Entity-Relationship Model

Databases come in various sizes, comprising different numbers of tables and relationships. This is why we use diagrams when designing databases – they offer a visual representation of the database's structure.

Let's get acquainted with the most commonly used diagram in database design: the entity-relationship model (often abbreviated as ER model). For instance:

In this example, we have two entities: School and Student. The School entity boasts attributes like id, name, and location, whereas the Student entity features attributes such as id, name, and surname. There exists a relationship between the Student and School entities, which we label as "study".

In tables of relational databases, this can be depicted using a foreign key:
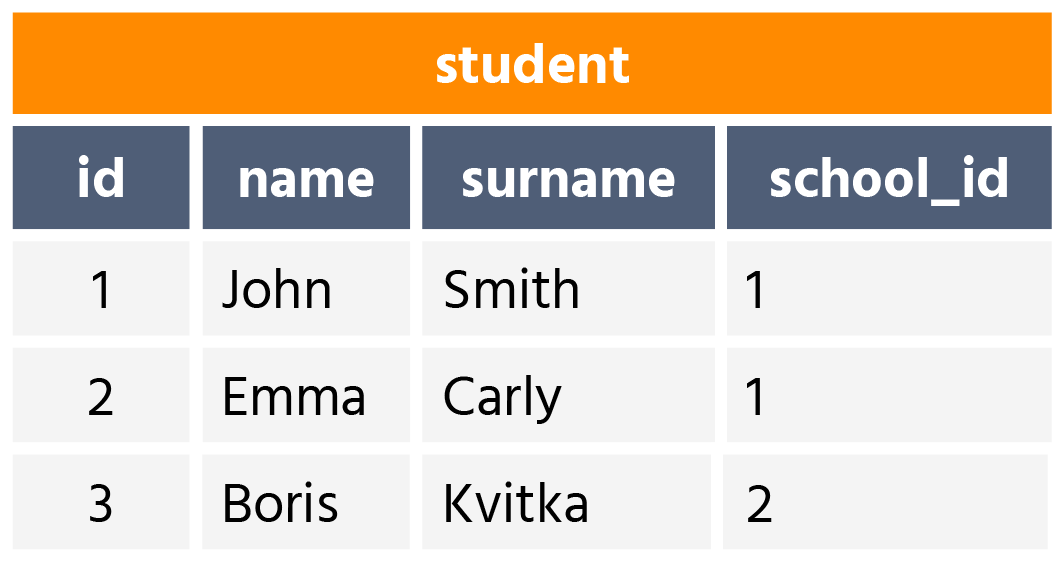
The "study" relationship is captured using a foreign key (the school_id column in this case).

Such models are instrumental in crafting a coherent database structure.

Concepts

The ER model is underpinned by three essential concepts:

  • Entities: These can be tangible or abstract objects, like schools and students. Represented by a Rectangle;

  • Attributes: These are features or properties tied to entities. For instance, a school might have attributes like location or founding year, while a student might have age or group. Represented by an Ellipse;

  • Relationships: These signify the interactions or connections between entities or attributes. Represented by a Rhombus.

You can see the graphical representation of these elements in the image provided:

Modern Entity-Relationship Diagram Presentation

Given that attribute shapes can take up a significant amount of space on a diagram, there's an alternative representation:
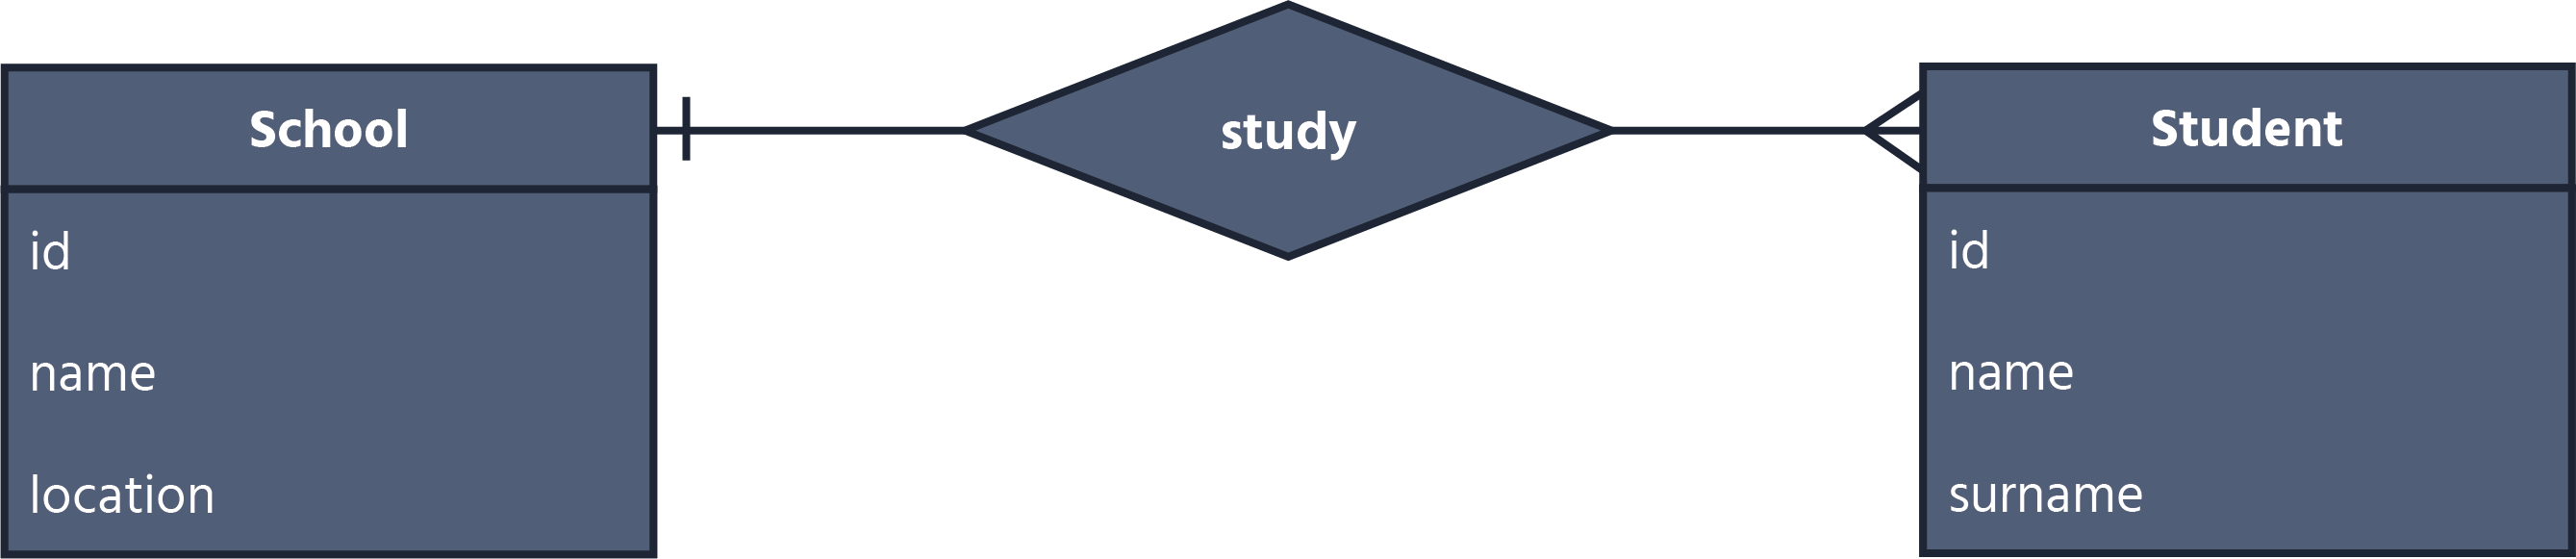
In this format, you'll notice a single-column table. The header denotes the entity, while each row below corresponds to the attributes linked to that entity.

War alles klar?

Wie können wir es verbessern?

Danke für Ihr Feedback!

Abschnitt 1. Kapitel 3
some-alt