Notice: This page requires JavaScript to function properly.
Please enable JavaScript in your browser settings or update your browser.
Histplot | Distributions of Data
Deep Dive into the seaborn Visualization
course content

Contenido del Curso

Deep Dive into the seaborn Visualization

Deep Dive into the seaborn Visualization

1. Light Start
2. Distributions of Data
3. Categorical Plot Types
4. Matrix Plots
5. Multi-Plot Grids
6. Regression Models

bookHistplot

The distributions module contains several functions designed to answer questions such as these. The axes-level functions are histplot, kdeplot, ecdfplot, and rugplot. They are grouped together within the figure-level displot function.

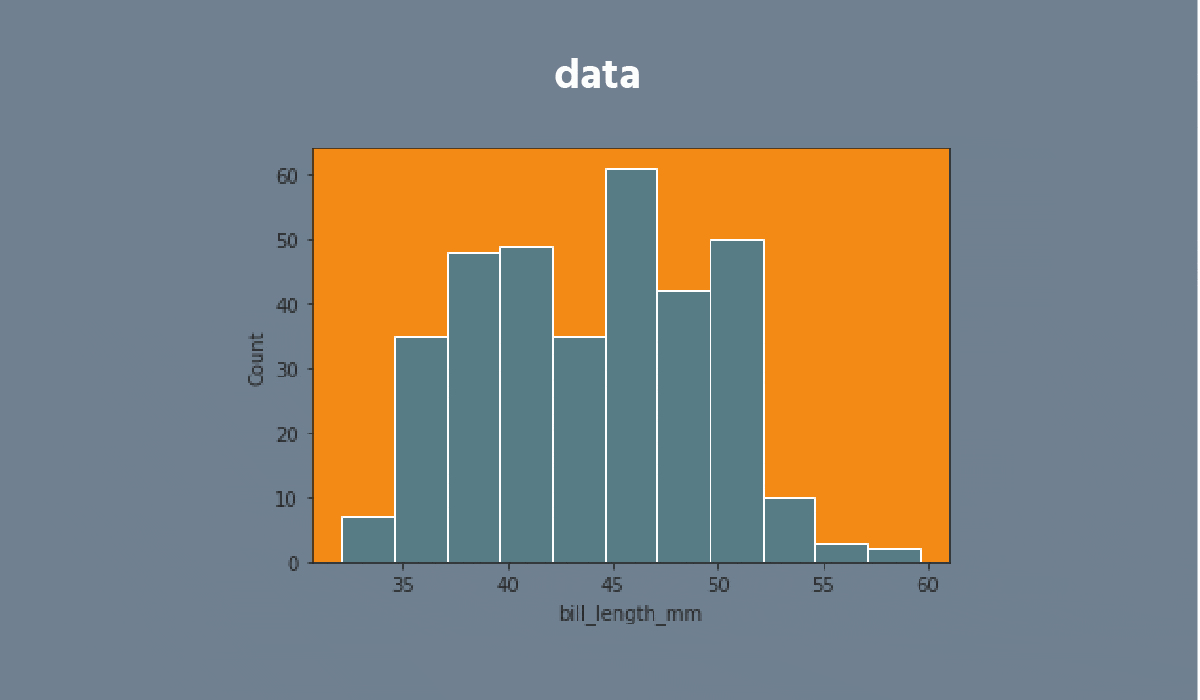
A histplot is a classic visualization tool that represents the distribution of one or more variables by counting the number of observations that fall within discrete bins.

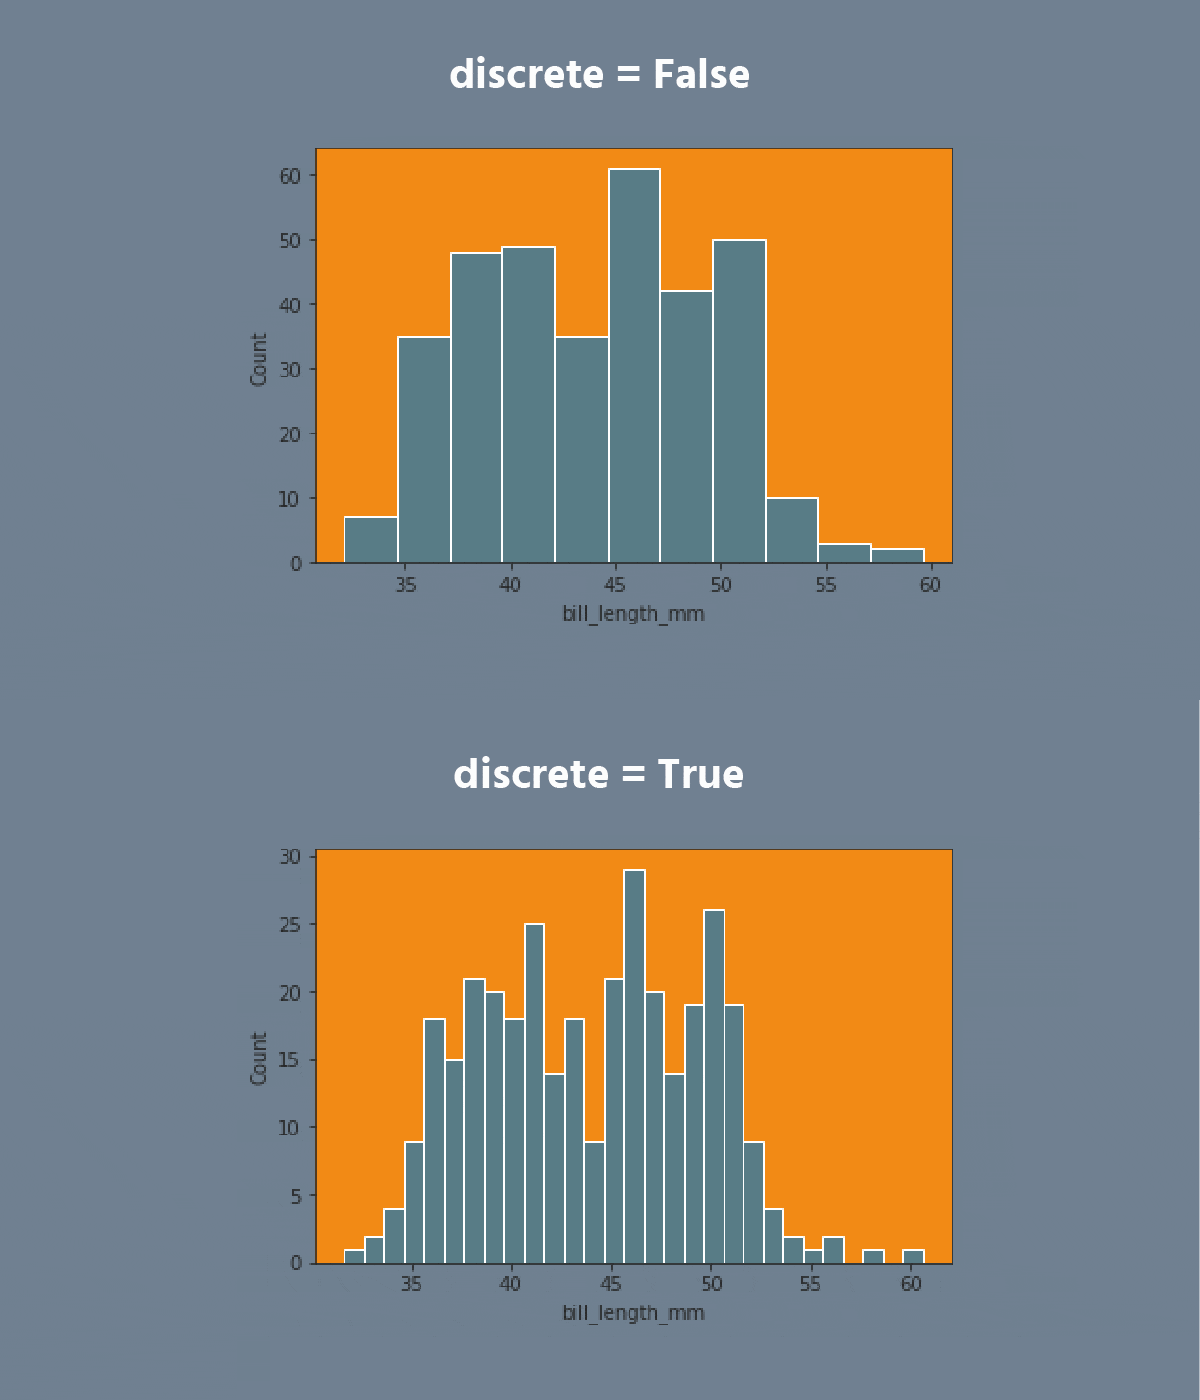
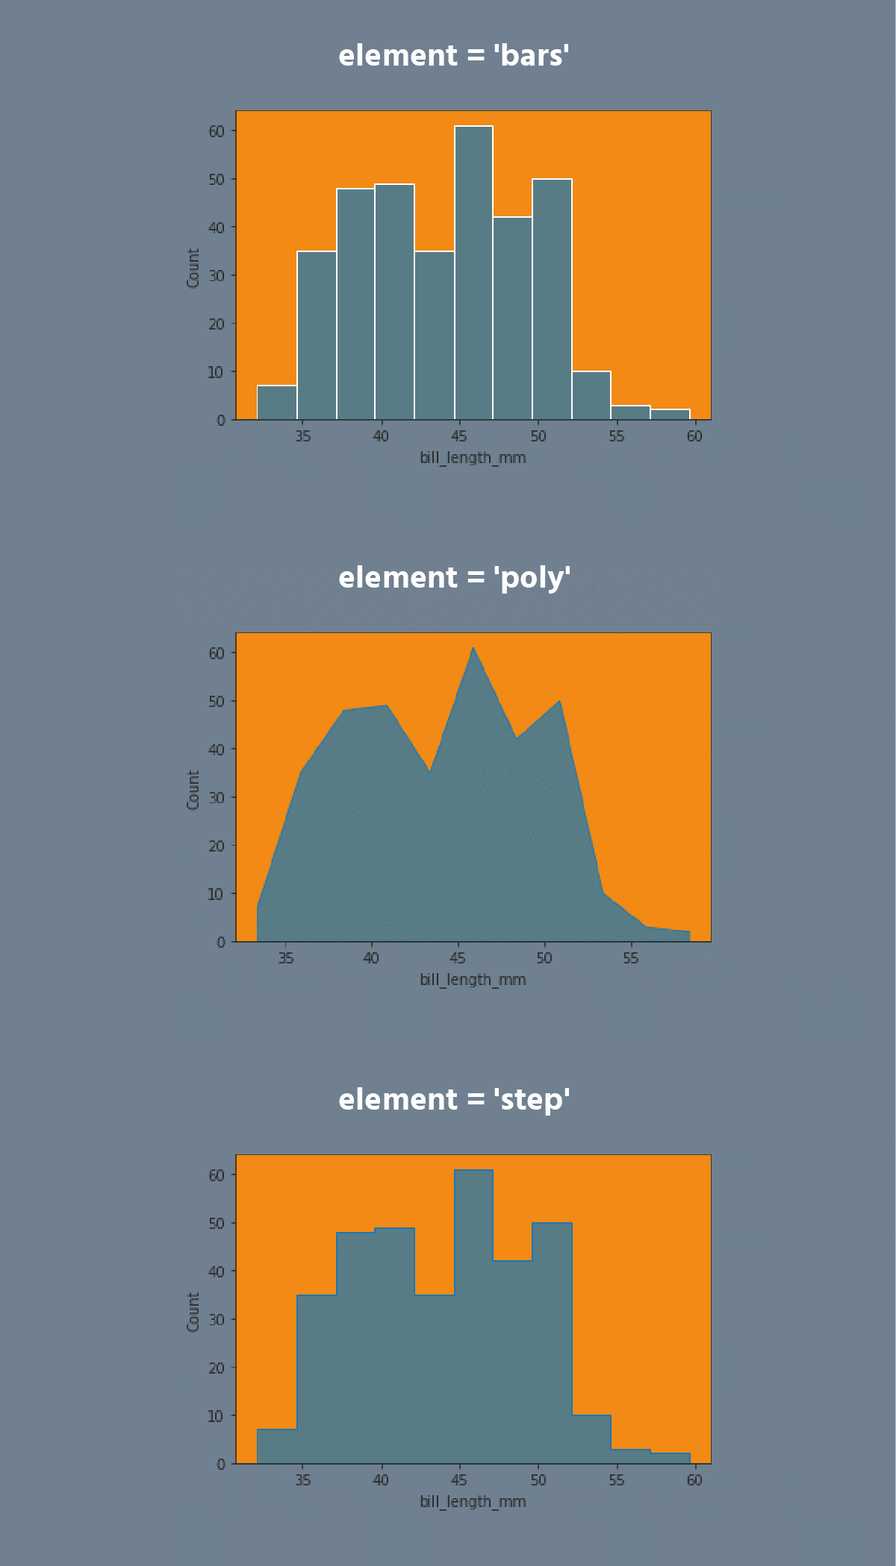
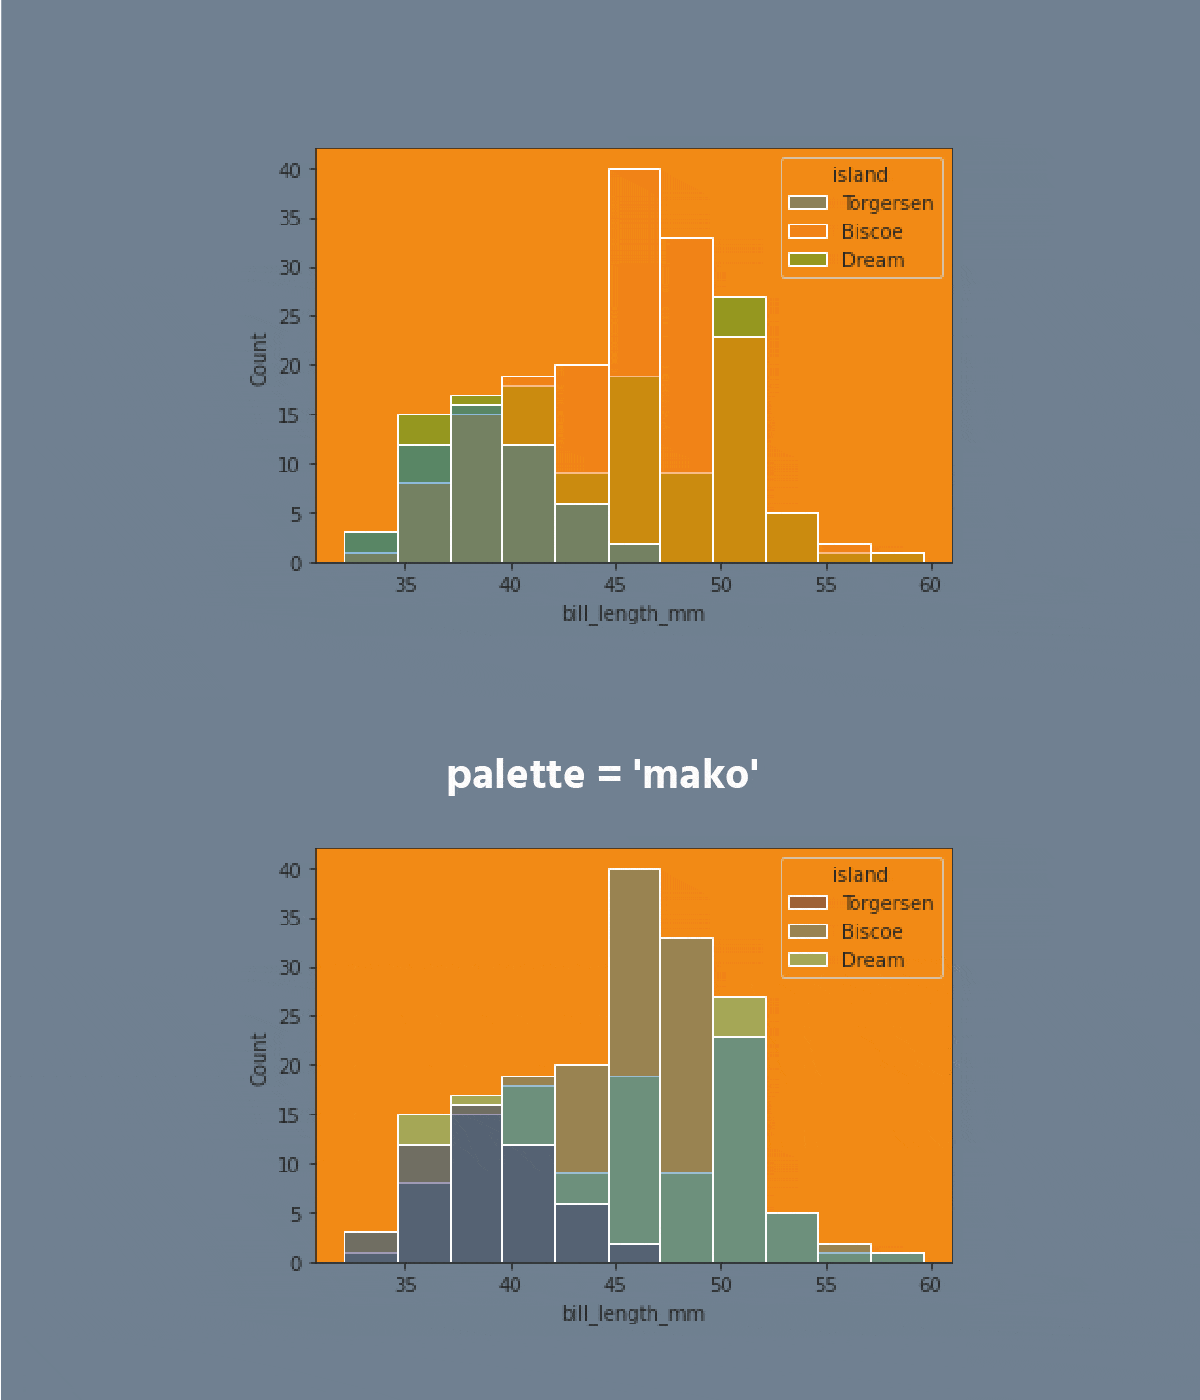
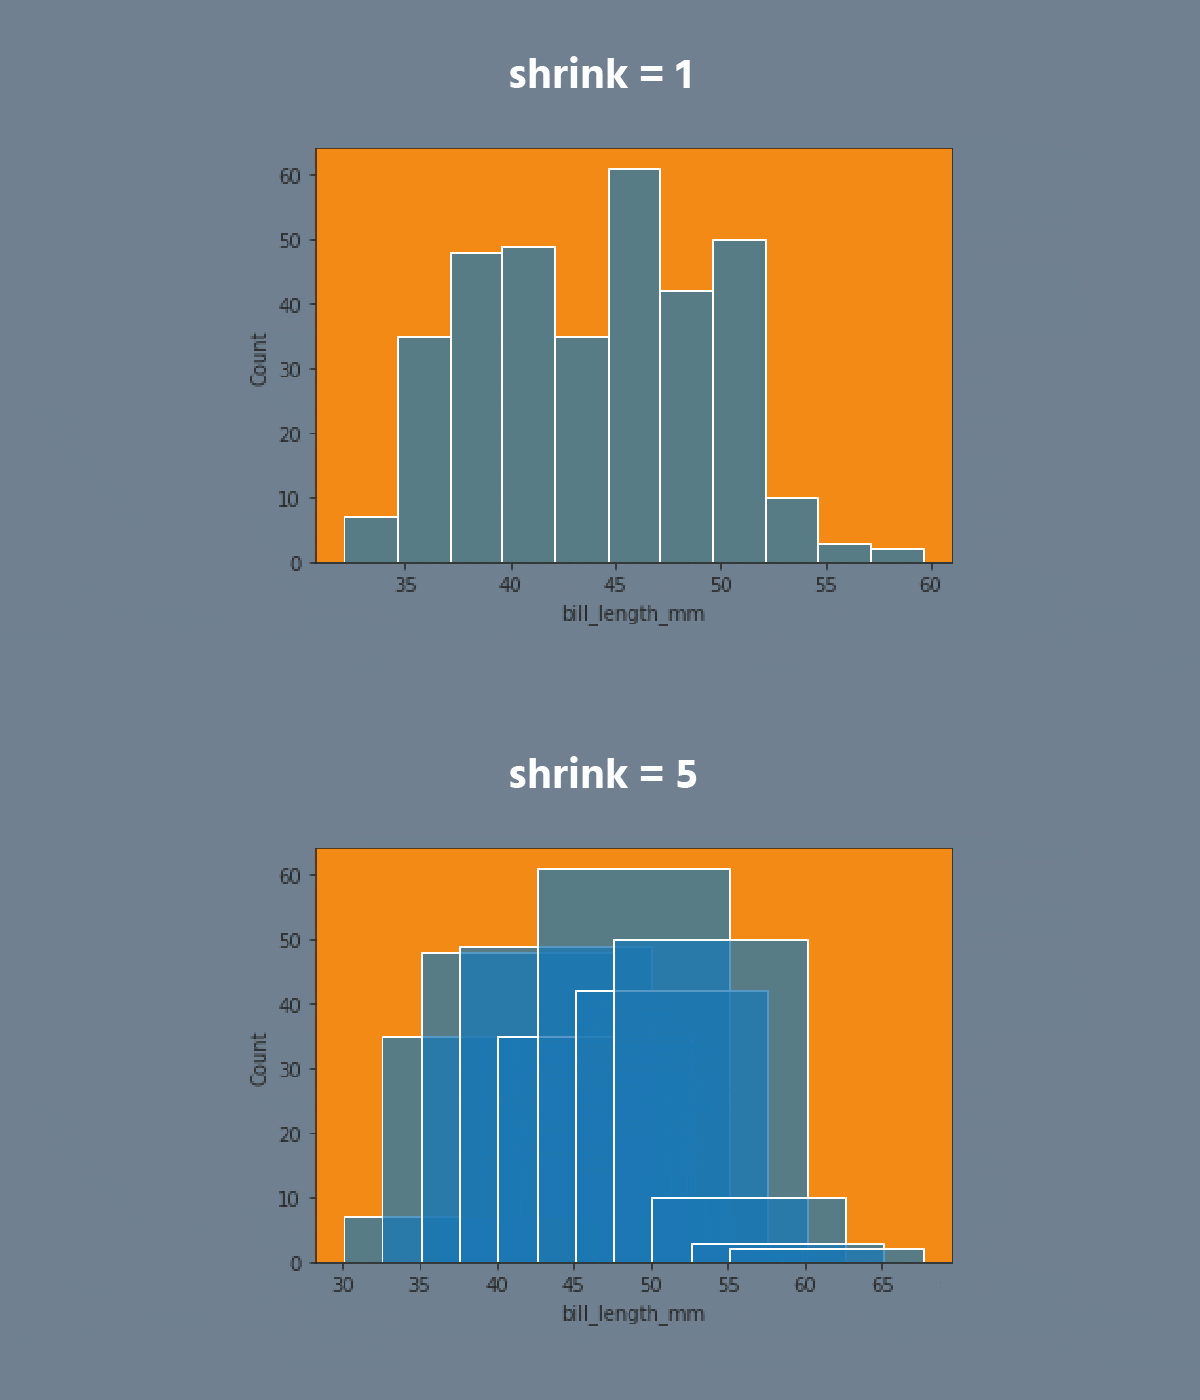
Click the slider to view possible arguments for the plot!
carousel-imgcarousel-imgcarousel-imgcarousel-imgcarousel-imgcarousel-imgcarousel-imgcarousel-imgcarousel-imgcarousel-imgcarousel-imgcarousel-imgcarousel-imgcarousel-imgcarousel-imgcarousel-img

Don't forget to return back after exploring the dataset!

Note

Use plt.show() to display the plot.

Tarea
test

Swipe to show code editor

  1. Create the histplot using the seaborn library:
  • Set the x parameter equals the 'bill_length_mm';
  • Set the hue parameter equals the 'island';
  • Set the element parameter equals the 'step';
  • Set the stat parameter equals the 'density';
  • Set the binwidth parameter equals 1;
  • Set the 'flare' palette;
  • Use the df data for the plot;
  • Display the plot.

Switch to desktopCambia al escritorio para practicar en el mundo realContinúe desde donde se encuentra utilizando una de las siguientes opciones
¿Todo estuvo claro?

¿Cómo podemos mejorarlo?

¡Gracias por tus comentarios!

Sección 2. Capítulo 1
toggle bottom row

bookHistplot

The distributions module contains several functions designed to answer questions such as these. The axes-level functions are histplot, kdeplot, ecdfplot, and rugplot. They are grouped together within the figure-level displot function.

A histplot is a classic visualization tool that represents the distribution of one or more variables by counting the number of observations that fall within discrete bins.

Click the slider to view possible arguments for the plot!

carousel-imgcarousel-imgcarousel-imgcarousel-imgcarousel-imgcarousel-imgcarousel-imgcarousel-imgcarousel-imgcarousel-imgcarousel-imgcarousel-imgcarousel-imgcarousel-imgcarousel-imgcarousel-img

Don't forget to return back after exploring the dataset!

Note

Use plt.show() to display the plot.

Tarea
test

Swipe to show code editor

  1. Create the histplot using the seaborn library:
  • Set the x parameter equals the 'bill_length_mm';
  • Set the hue parameter equals the 'island';
  • Set the element parameter equals the 'step';
  • Set the stat parameter equals the 'density';
  • Set the binwidth parameter equals 1;
  • Set the 'flare' palette;
  • Use the df data for the plot;
  • Display the plot.

Switch to desktopCambia al escritorio para practicar en el mundo realContinúe desde donde se encuentra utilizando una de las siguientes opciones
¿Todo estuvo claro?

¿Cómo podemos mejorarlo?

¡Gracias por tus comentarios!

Sección 2. Capítulo 1
toggle bottom row

bookHistplot

The distributions module contains several functions designed to answer questions such as these. The axes-level functions are histplot, kdeplot, ecdfplot, and rugplot. They are grouped together within the figure-level displot function.

A histplot is a classic visualization tool that represents the distribution of one or more variables by counting the number of observations that fall within discrete bins.

Click the slider to view possible arguments for the plot!

carousel-imgcarousel-imgcarousel-imgcarousel-imgcarousel-imgcarousel-imgcarousel-imgcarousel-imgcarousel-imgcarousel-imgcarousel-imgcarousel-imgcarousel-imgcarousel-imgcarousel-imgcarousel-img

Don't forget to return back after exploring the dataset!

Note

Use plt.show() to display the plot.

Tarea
test

Swipe to show code editor

  1. Create the histplot using the seaborn library:
  • Set the x parameter equals the 'bill_length_mm';
  • Set the hue parameter equals the 'island';
  • Set the element parameter equals the 'step';
  • Set the stat parameter equals the 'density';
  • Set the binwidth parameter equals 1;
  • Set the 'flare' palette;
  • Use the df data for the plot;
  • Display the plot.

Switch to desktopCambia al escritorio para practicar en el mundo realContinúe desde donde se encuentra utilizando una de las siguientes opciones
¿Todo estuvo claro?

¿Cómo podemos mejorarlo?

¡Gracias por tus comentarios!

The distributions module contains several functions designed to answer questions such as these. The axes-level functions are histplot, kdeplot, ecdfplot, and rugplot. They are grouped together within the figure-level displot function.

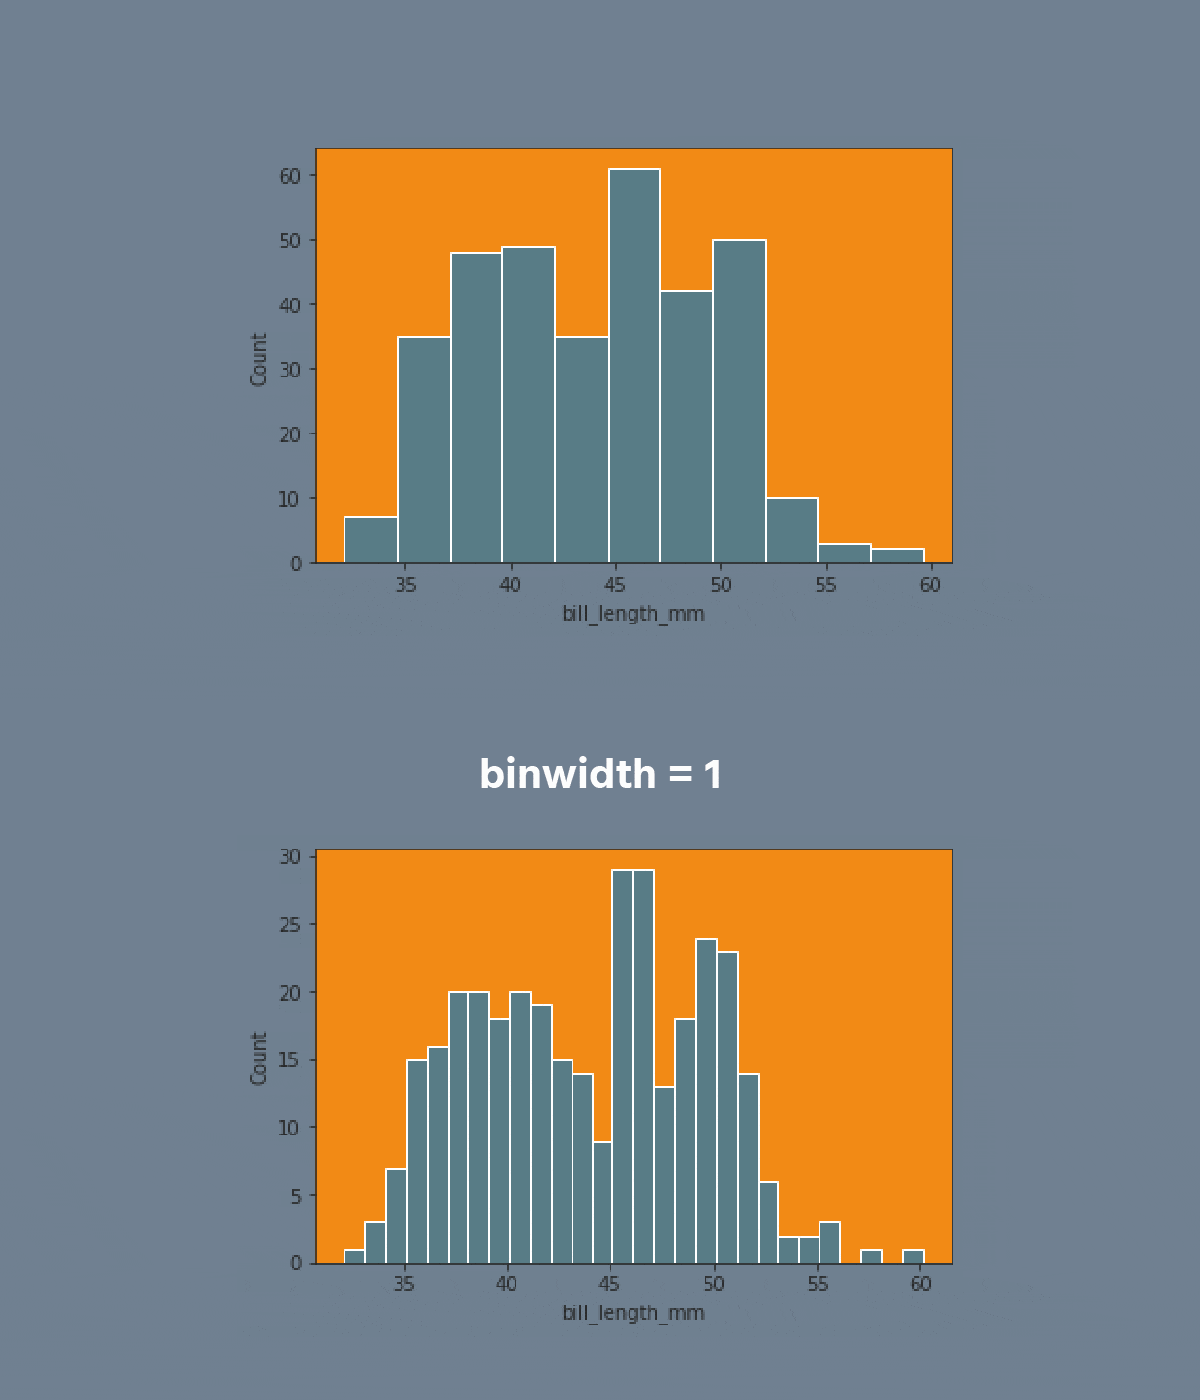
A histplot is a classic visualization tool that represents the distribution of one or more variables by counting the number of observations that fall within discrete bins.

Click the slider to view possible arguments for the plot!
carousel-imgcarousel-imgcarousel-imgcarousel-imgcarousel-imgcarousel-imgcarousel-imgcarousel-imgcarousel-imgcarousel-imgcarousel-imgcarousel-imgcarousel-imgcarousel-imgcarousel-imgcarousel-img

Don't forget to return back after exploring the dataset!

Note

Use plt.show() to display the plot.

Tarea
test

Swipe to show code editor

  1. Create the histplot using the seaborn library:
  • Set the x parameter equals the 'bill_length_mm';
  • Set the hue parameter equals the 'island';
  • Set the element parameter equals the 'step';
  • Set the stat parameter equals the 'density';
  • Set the binwidth parameter equals 1;
  • Set the 'flare' palette;
  • Use the df data for the plot;
  • Display the plot.

Switch to desktopCambia al escritorio para practicar en el mundo realContinúe desde donde se encuentra utilizando una de las siguientes opciones
Sección 2. Capítulo 1
Switch to desktopCambia al escritorio para practicar en el mundo realContinúe desde donde se encuentra utilizando una de las siguientes opciones
We're sorry to hear that something went wrong. What happened?
some-alt