 Displot
Note
displot=FacetGrid(we will study this plot later) +histplot/kdeplot/ecdfplot
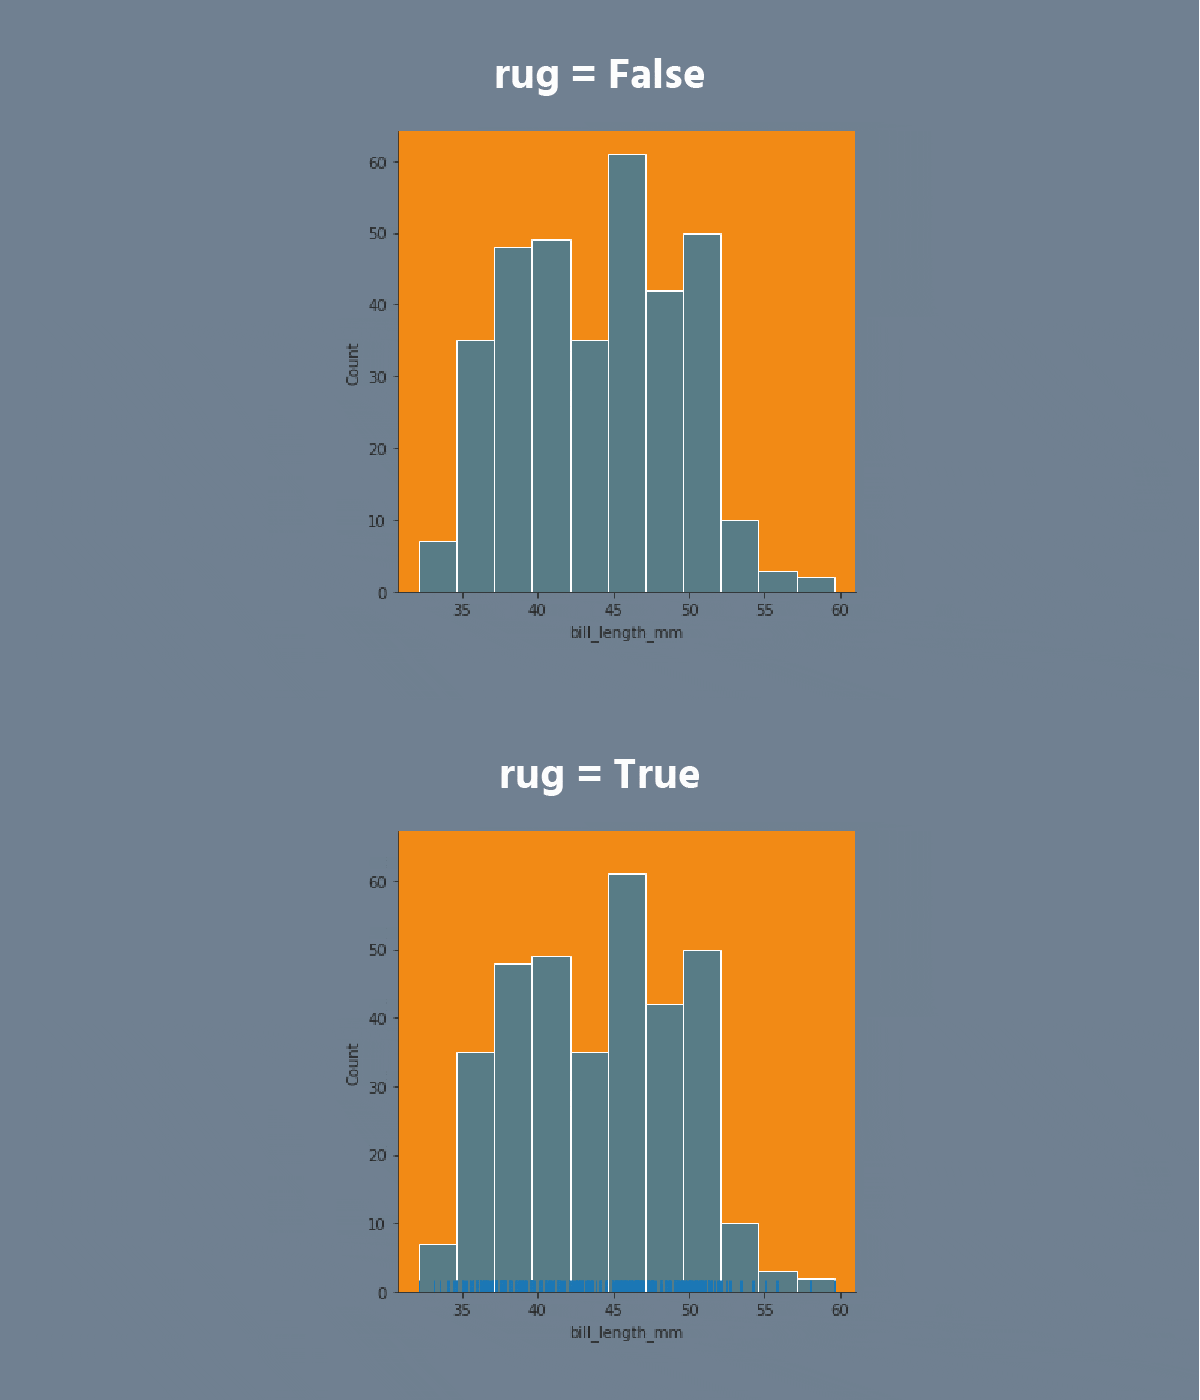
The displot provides access to several approaches for visualizing the univariate or bivariate distribution of data, including subsets of data defined by semantic mapping and faceting across multiple subplots.
The kind parameter selects the approach to use: histplot, kdeplot, ecdfplot.


Swipe to start coding
- Set the
'darkgrid'style. - Create the
displotusing theseabornlibrary:
- Set the
xparameter equals the'carat'; - Set the
hueparameter equals the'cut'; - Set the
colparameter equals the'color'; - Set the
kindparameter equals the'kde'; - Set the
multipleparameter equals the'fill'; - Set the
paletteequals the'viridis'; - Set the data.
Ratkaisu
Kiitos palautteestasi!
single
Kysy tekoälyä
Kysy tekoälyä

Kysy mitä tahansa tai kokeile jotakin ehdotetuista kysymyksistä aloittaaksesi keskustelumme

Mahtavaa!
Completion arvosana parantunut arvoon 4.35 Displot
Pyyhkäise näyttääksesi valikon
Note
displot=FacetGrid(we will study this plot later) +histplot/kdeplot/ecdfplot
The displot provides access to several approaches for visualizing the univariate or bivariate distribution of data, including subsets of data defined by semantic mapping and faceting across multiple subplots.
The kind parameter selects the approach to use: histplot, kdeplot, ecdfplot.


Swipe to start coding
- Set the
'darkgrid'style. - Create the
displotusing theseabornlibrary:
- Set the
xparameter equals the'carat'; - Set the
hueparameter equals the'cut'; - Set the
colparameter equals the'color'; - Set the
kindparameter equals the'kde'; - Set the
multipleparameter equals the'fill'; - Set the
paletteequals the'viridis'; - Set the data.
Ratkaisu
Kiitos palautteestasi!
single