 Barplot
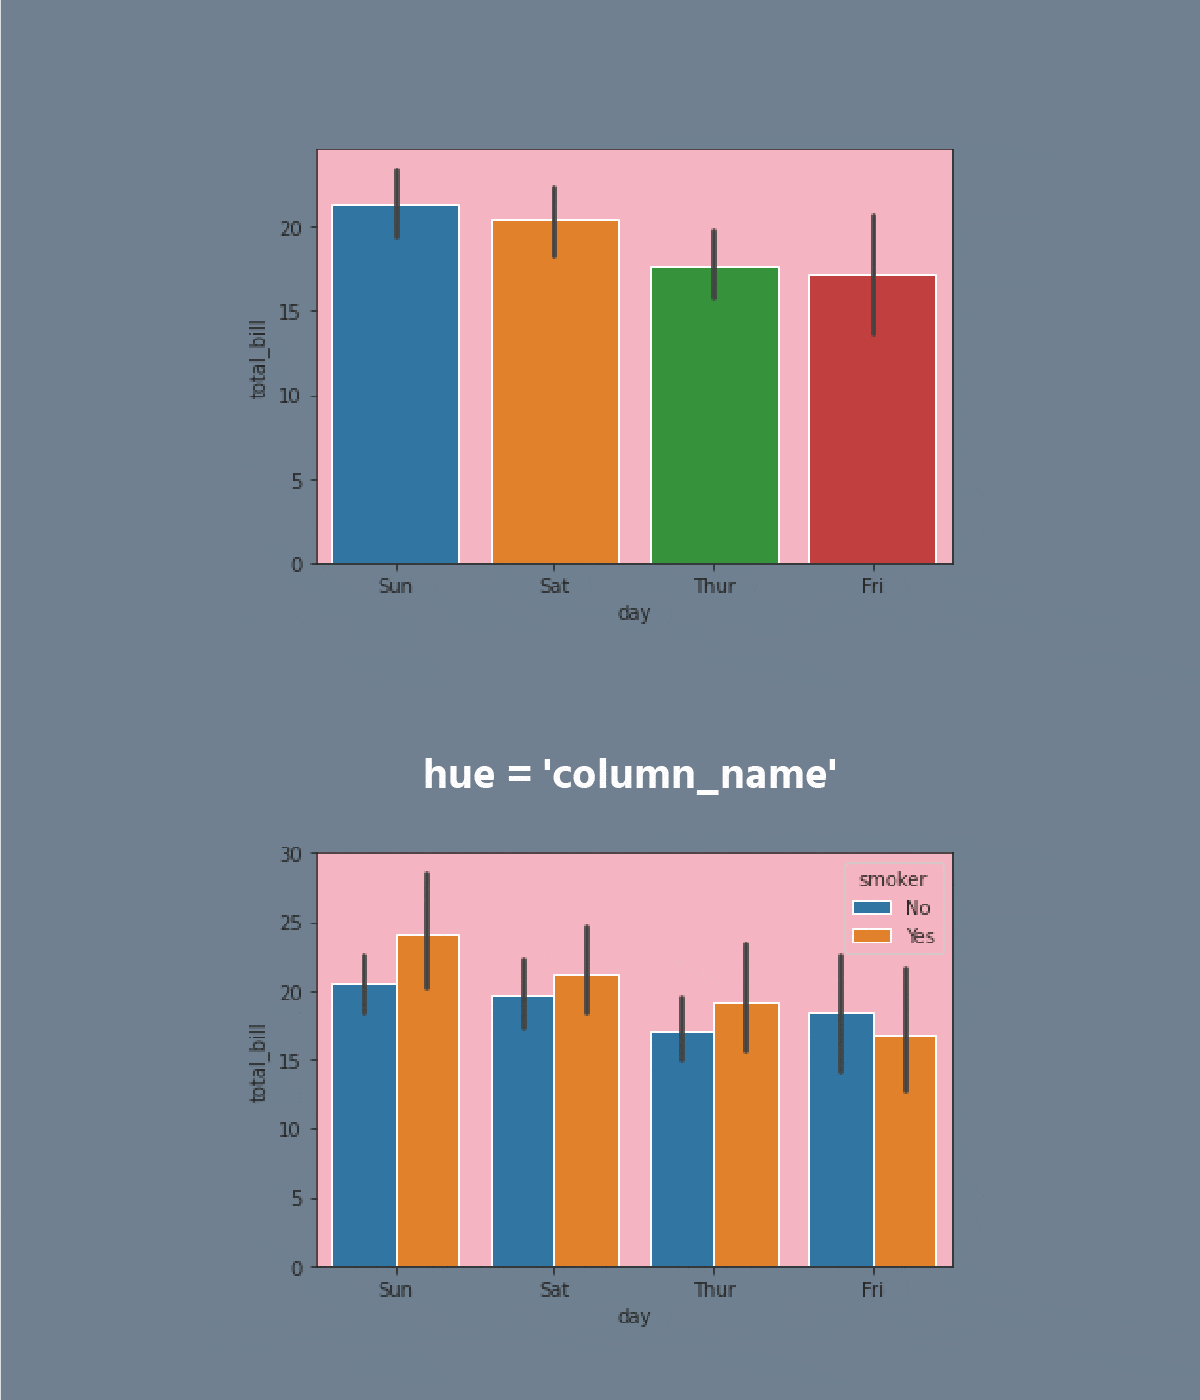
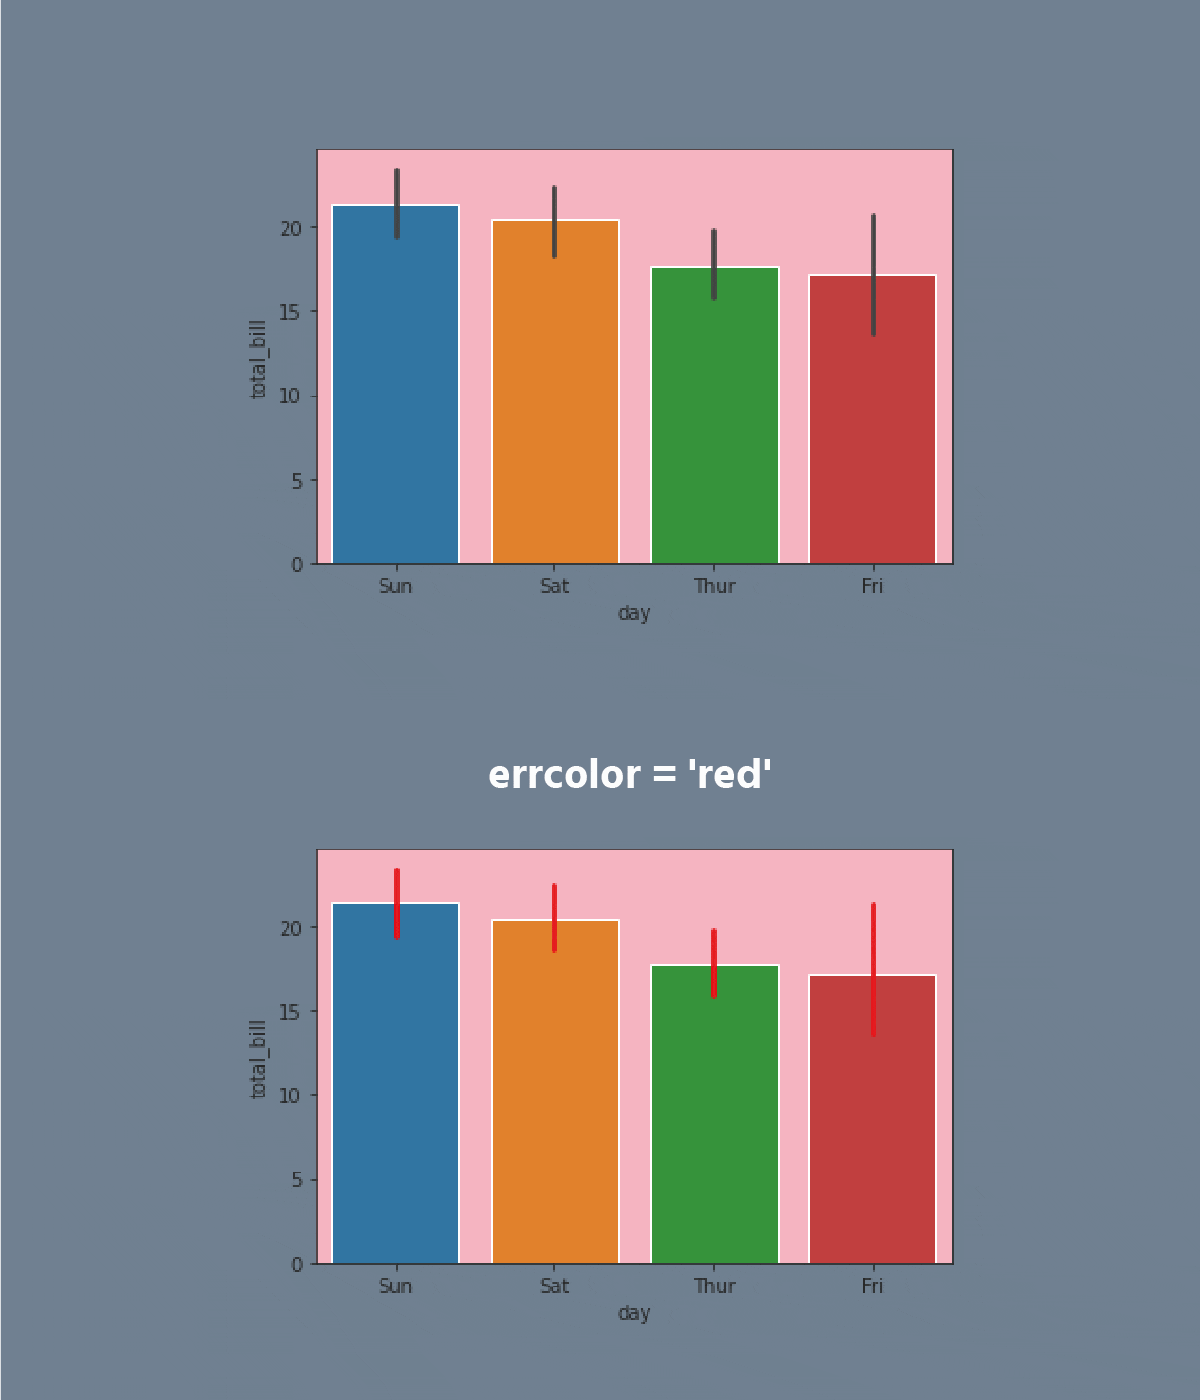
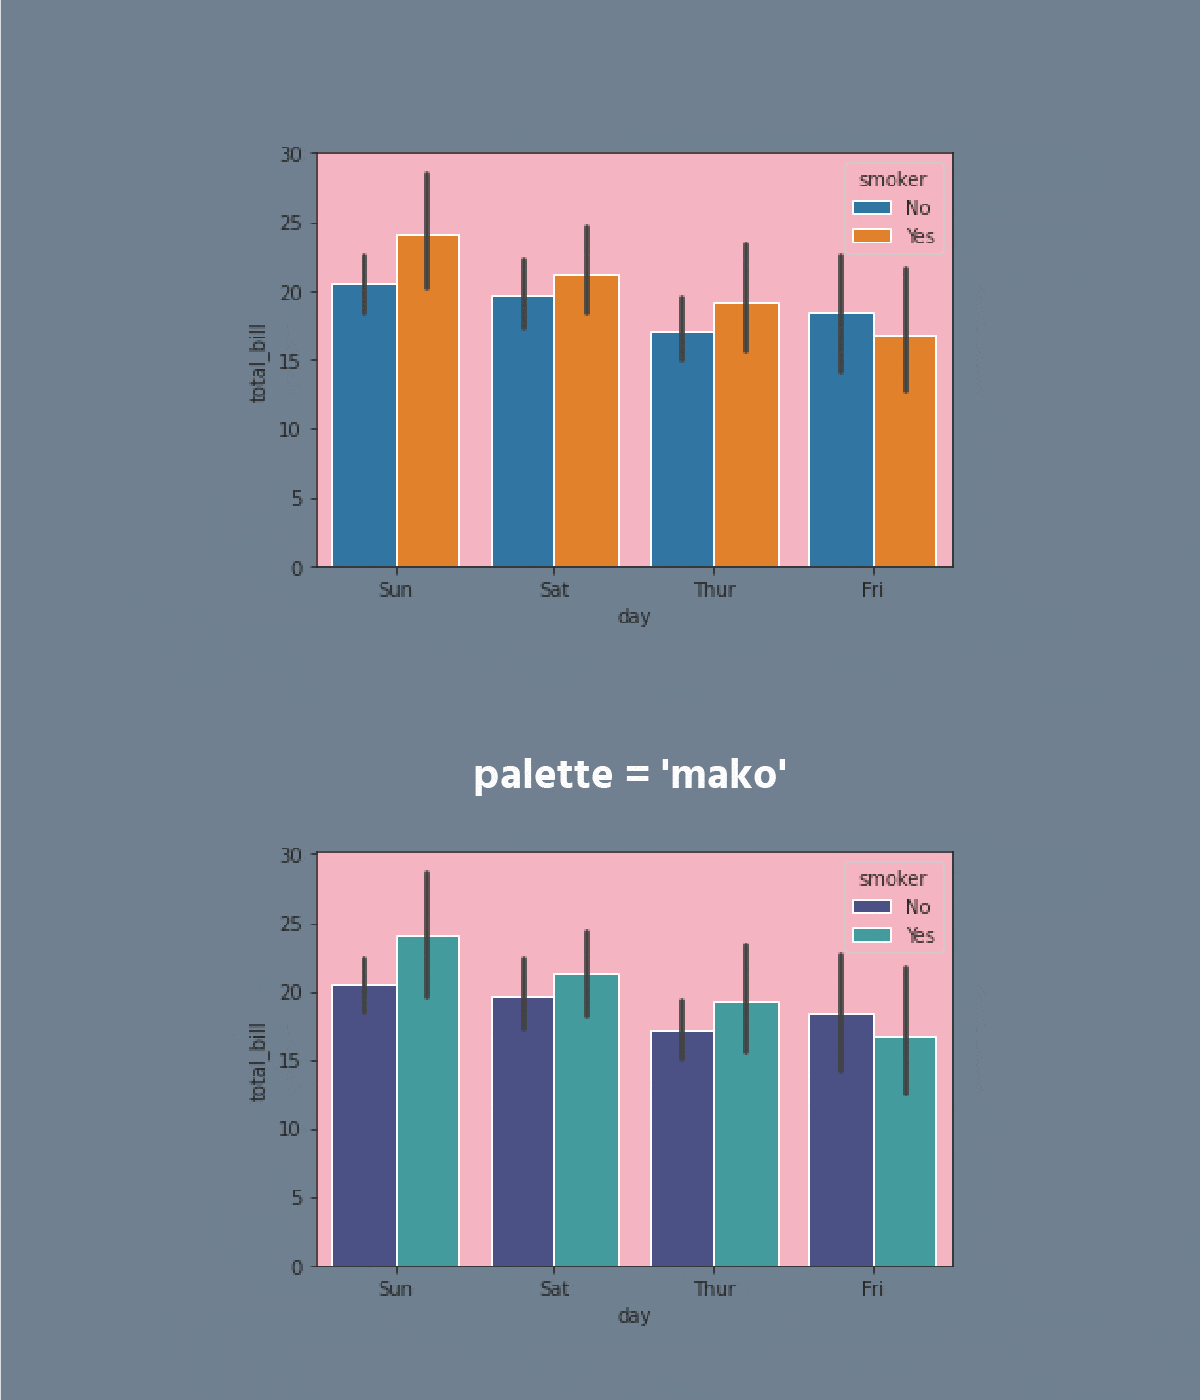
A barplot represents an estimate of the central tendency for a numeric variable with the height of each rectangle and provides some indication of the uncertainty around that estimate using error bars.
Bar plots include 0 in the quantitative axis range, and they are a good choice when 0 is a meaningful value for the quantitative variable, and you want to make comparisons against it.


Swipe to start coding
- Set the
'ticks'style. - Create the
barplotusing theseabornlibrary:
- Set the
xparameter equals the'day'; - Set the
yparameter equals the'total_bill'; - Set the
hueparameter equals the'smoker'; - Set the
linewidthparameter equals2.5; - Set the
capsizeparameter equals0.1; - Set the
'pink'errcolorparameter; - Set the
'magma'palette; - Set the data;
- Display the plot.
Ratkaisu
Kiitos palautteestasi!
single
Kysy tekoälyä
Kysy tekoälyä

Kysy mitä tahansa tai kokeile jotakin ehdotetuista kysymyksistä aloittaaksesi keskustelumme

Mahtavaa!
Completion arvosana parantunut arvoon 4.35 Barplot
Pyyhkäise näyttääksesi valikon
A barplot represents an estimate of the central tendency for a numeric variable with the height of each rectangle and provides some indication of the uncertainty around that estimate using error bars.
Bar plots include 0 in the quantitative axis range, and they are a good choice when 0 is a meaningful value for the quantitative variable, and you want to make comparisons against it.


Swipe to start coding
- Set the
'ticks'style. - Create the
barplotusing theseabornlibrary:
- Set the
xparameter equals the'day'; - Set the
yparameter equals the'total_bill'; - Set the
hueparameter equals the'smoker'; - Set the
linewidthparameter equals2.5; - Set the
capsizeparameter equals0.1; - Set the
'pink'errcolorparameter; - Set the
'magma'palette; - Set the data;
- Display the plot.
Ratkaisu
Kiitos palautteestasi!
single