
single
Describing the Data
メニューを表示するにはスワイプしてください
pandas offers the handy mean() method that calculates the average of all values for each column.
df = pd.read_csv(file.csv)
mean_values = df.mean()
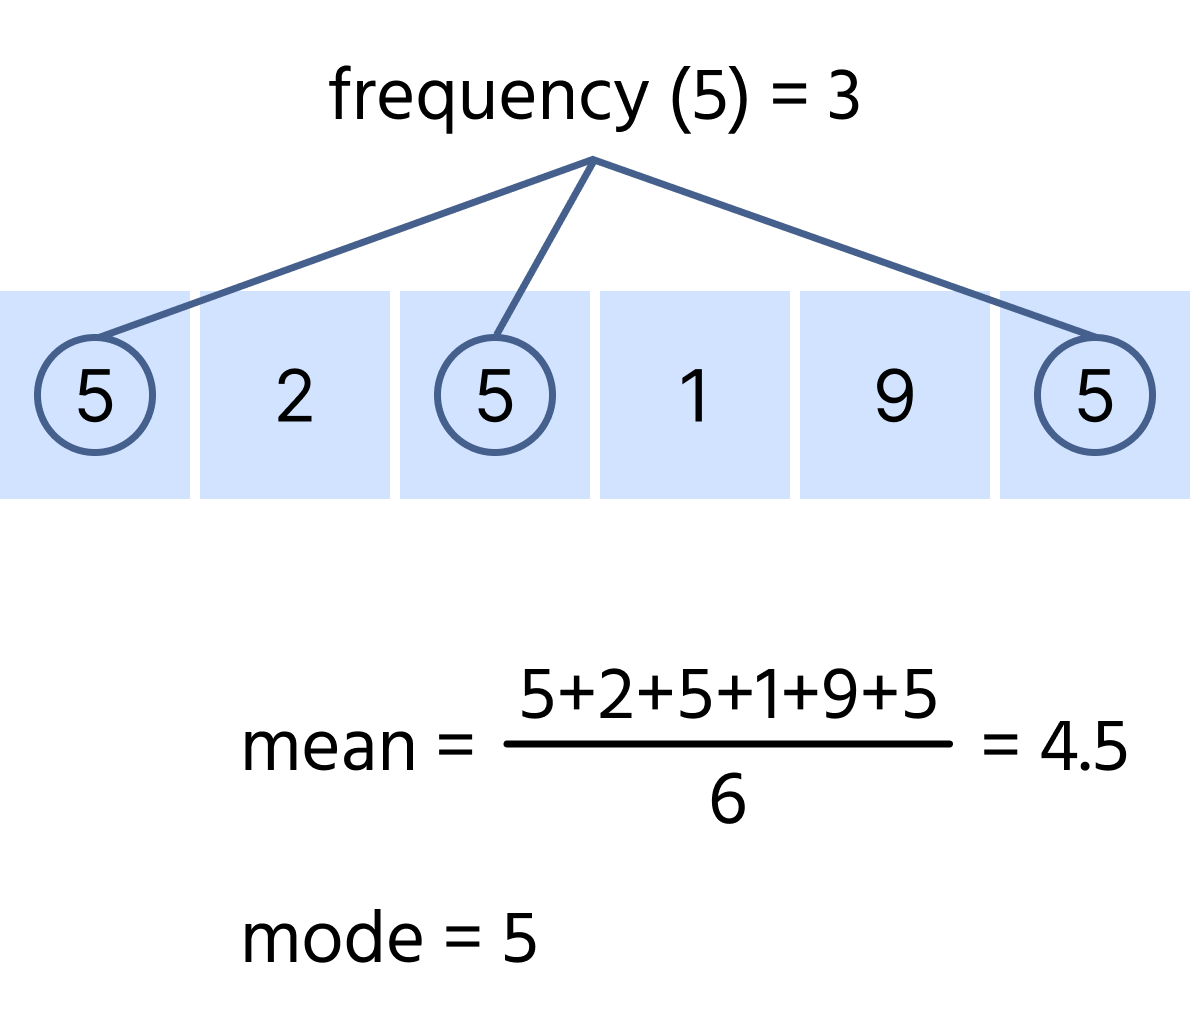
You can also the same method to determine the average value for a specific column:
df = pd.read_csv(file.csv)
mean_values = df['column_name'].mean()
pandas also provides the mode() method, which identifies the most frequently occurring value in each column.
df = pd.read_csv(file.csv)
mode_values = df.mode()
To find the mode for a particular column, the same method is used:
df = pd.read_csv(file.csv)
mode_values = df['column_name'].mode()[0]

Use [0] after .mode() to extract the first value if multiple modes exist. Without it, the method returns an entire Series.
Another useful method in pandas is describe().
df = pd.read_csv(file.csv)
important_metrics = df.describe()
This method provides an overview of various metrics from the dataset, including:
- Total number of entries;
- Mean or average value;
- Standard deviation;
- The minimum and maximum values;
- The 25th, 50th (median), and 75th percentiles.
スワイプしてコーディングを開始
You are given a DataFrame named wine_data.
- Calculate the mean of the
'residual sugar'column and store the result in theresidual_sugar_meanvariable. - Calculate the mode of the
'fixed acidity'column and store the result in thefixed_acidity_modevariable. - Retrieve an overview of various statistics from
wine_dataand store the result in thedescribed_datavariable.
解答
 実践的な練習のためにデスクトップに切り替える下記のオプションのいずれかを利用して、現在の場所から続行する
フィードバックありがとうございます!
single
AIに質問する

AIに質問する

何でも質問するか、提案された質問の1つを試してチャットを始めてください
