多項式回帰の構築
メニューを表示するにはスワイプしてください
ファイルの読み込み
poly.csv を読み込み、内容を確認:
1234import pandas as pd file_link = 'https://codefinity-content-media.s3.eu-west-1.amazonaws.com/b22d1166-efda-45e8-979e-6c3ecfc566fc/poly.csv' df = pd.read_csv(file_link) print(df.head())
次に、関係性を可視化:
12345import matplotlib.pyplot as plt X = df['Feature'] y = df['Target'] plt.scatter(X, y) plt.show()
直線では適合が不十分なため、多項式回帰がより適している。
X̃ 行列の構築
X̃ を作成するには、二乗特徴量を手動で追加する方法がある:
df['Feature_squared'] = df['Feature'] ** 2
しかし、高次の場合は PolynomialFeatures の利用が容易。2次元構造が必要となる:
from sklearn.preprocessing import PolynomialFeatures
X = df[['Feature']]
poly = PolynomialFeatures(n)
X_tilde = poly.fit_transform(X)
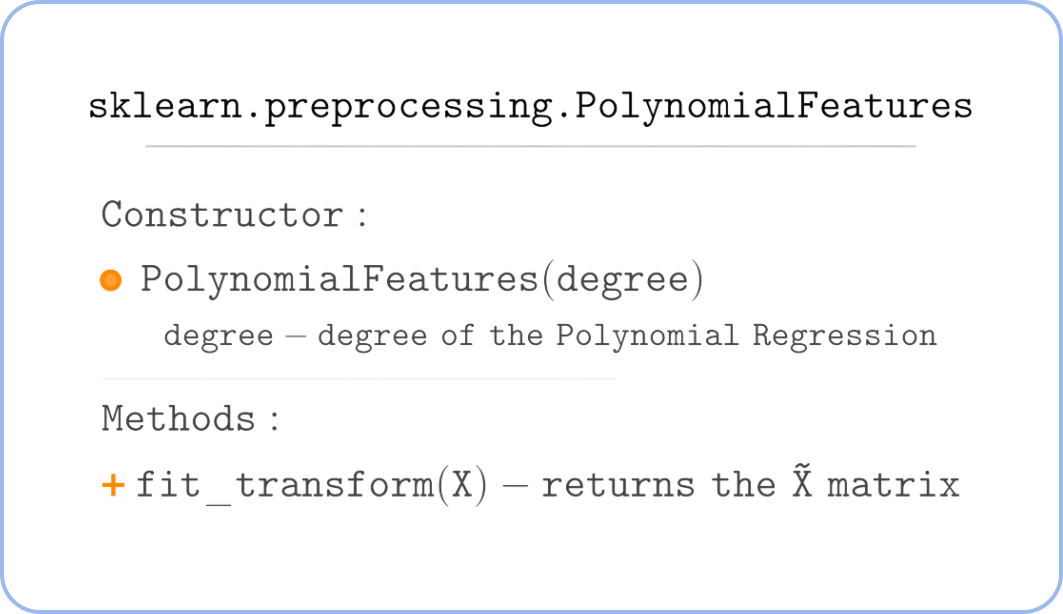
定数列も自動的に追加されるため、sm.add_constant()は不要。
Xが1次元の場合、次のように変換:
X = X.reshape(-1, 1)
多項式回帰の構築
import statsmodels.api as sm
y = df['Target']
X = df[['Feature']]
X_tilde = PolynomialFeatures(n).fit_transform(X)
model = sm.OLS(y, X_tilde).fit()
予測時も同様に新しいデータを変換:
X_new_tilde = PolynomialFeatures(n).fit_transform(X_new)
y_pred = model.predict(X_new_tilde)
完全な例
123456789101112131415161718import pandas as pd, numpy as np, matplotlib.pyplot as plt import statsmodels.api as sm from sklearn.preprocessing import PolynomialFeatures df = pd.read_csv(file_link) n = 2 X = df[['Feature']] y = df['Target'] X_tilde = PolynomialFeatures(n).fit_transform(X) model = sm.OLS(y, X_tilde).fit() X_new = np.linspace(-0.1, 1.5, 80).reshape(-1,1) X_new_tilde = PolynomialFeatures(n).fit_transform(X_new) y_pred = model.predict(X_new_tilde) plt.scatter(X, y) plt.plot(X_new, y_pred) plt.show()
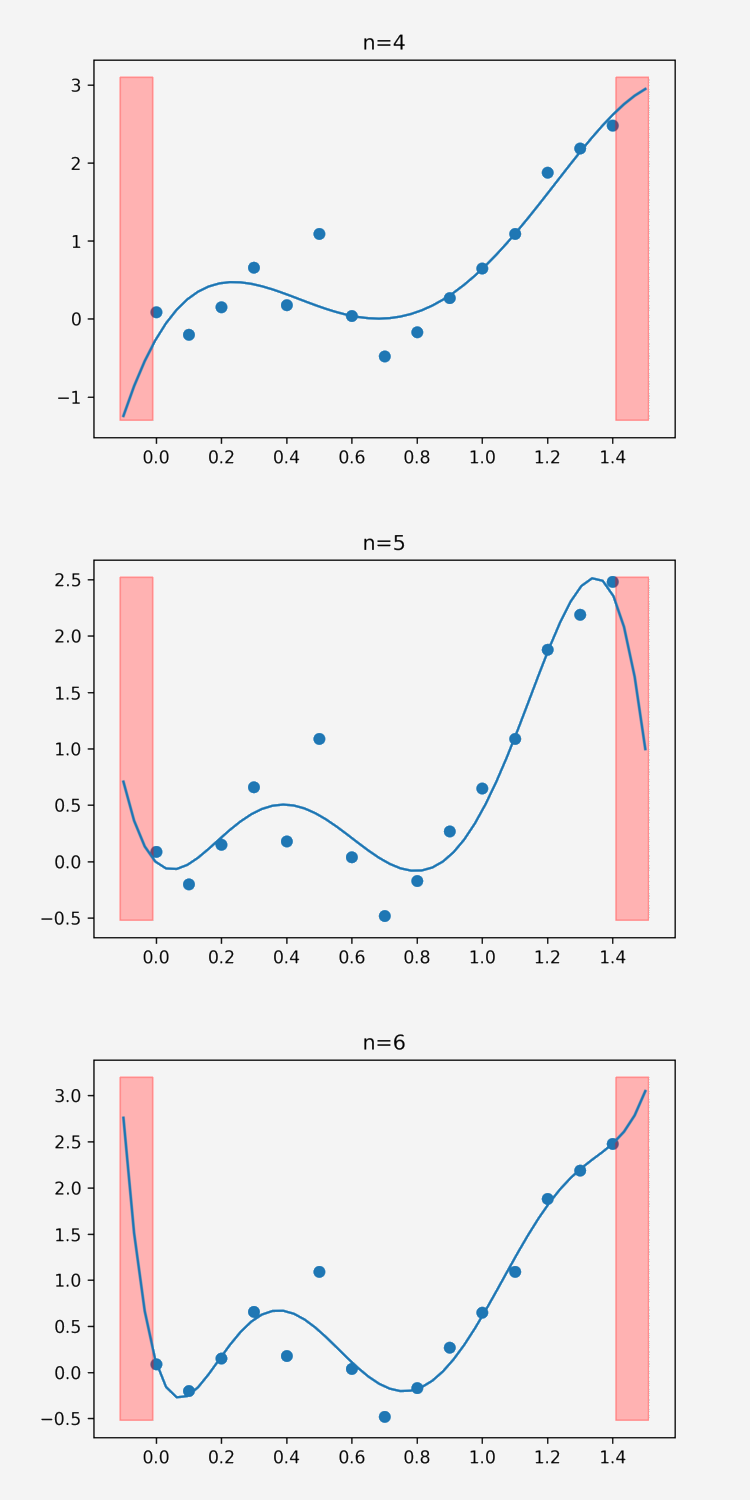
異なる n の値を試して、曲線の変化や元の特徴範囲外での予測の挙動を確認—次の章への導入。
すべて明確でしたか?
フィードバックありがとうございます!
セクション 3. 章 3
AIに質問する

AIに質問する

何でも質問するか、提案された質問の1つを試してチャットを始めてください
多項式回帰の構築
ファイルの読み込み
poly.csv を読み込み、内容を確認:
1234import pandas as pd file_link = 'https://codefinity-content-media.s3.eu-west-1.amazonaws.com/b22d1166-efda-45e8-979e-6c3ecfc566fc/poly.csv' df = pd.read_csv(file_link) print(df.head())
次に、関係性を可視化:
12345import matplotlib.pyplot as plt X = df['Feature'] y = df['Target'] plt.scatter(X, y) plt.show()
直線では適合が不十分なため、多項式回帰がより適している。
X̃ 行列の構築
X̃ を作成するには、二乗特徴量を手動で追加する方法がある:
df['Feature_squared'] = df['Feature'] ** 2
しかし、高次の場合は PolynomialFeatures の利用が容易。2次元構造が必要となる:
from sklearn.preprocessing import PolynomialFeatures
X = df[['Feature']]
poly = PolynomialFeatures(n)
X_tilde = poly.fit_transform(X)
定数列も自動的に追加されるため、sm.add_constant()は不要。
Xが1次元の場合、次のように変換:
X = X.reshape(-1, 1)
多項式回帰の構築
import statsmodels.api as sm
y = df['Target']
X = df[['Feature']]
X_tilde = PolynomialFeatures(n).fit_transform(X)
model = sm.OLS(y, X_tilde).fit()
予測時も同様に新しいデータを変換:
X_new_tilde = PolynomialFeatures(n).fit_transform(X_new)
y_pred = model.predict(X_new_tilde)
完全な例
123456789101112131415161718import pandas as pd, numpy as np, matplotlib.pyplot as plt import statsmodels.api as sm from sklearn.preprocessing import PolynomialFeatures df = pd.read_csv(file_link) n = 2 X = df[['Feature']] y = df['Target'] X_tilde = PolynomialFeatures(n).fit_transform(X) model = sm.OLS(y, X_tilde).fit() X_new = np.linspace(-0.1, 1.5, 80).reshape(-1,1) X_new_tilde = PolynomialFeatures(n).fit_transform(X_new) y_pred = model.predict(X_new_tilde) plt.scatter(X, y) plt.plot(X_new, y_pred) plt.show()
異なる n の値を試して、曲線の変化や元の特徴範囲外での予測の挙動を確認—次の章への導入。
すべて明確でしたか?
フィードバックありがとうございます!
セクション 3. 章 3
