seaborn
Seaborn is a high-level plotting library based on matplotlib. Let's have a look at its advantages in comparison to matplotlib:
- simpler interface;
- a wide range of default styles and color palettes;
- works well with
pandasDataFrame; - a wide range of built-in statistical functions.
Here is an example of a plot created using seaborn with just one line of code:
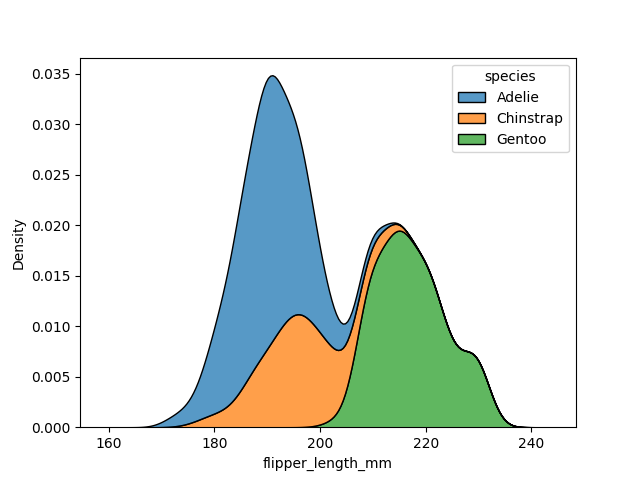
Apparently, everything you can accomplish using seaborn can be also done with matplotlib, yet it may often take more time and effort.
However, matplotlib being a rather low-level library in comparison, offers more flexibility for your plots, so if you need to create a rather unique plot with a lot of customizations, matplotlib is still the best choice.
Takk for tilbakemeldingene dine!
single
seaborn
Sveip for å vise menyen
Seaborn is a high-level plotting library based on matplotlib. Let's have a look at its advantages in comparison to matplotlib:
- simpler interface;
- a wide range of default styles and color palettes;
- works well with
pandasDataFrame; - a wide range of built-in statistical functions.
Here is an example of a plot created using seaborn with just one line of code:
Apparently, everything you can accomplish using seaborn can be also done with matplotlib, yet it may often take more time and effort.
However, matplotlib being a rather low-level library in comparison, offers more flexibility for your plots, so if you need to create a rather unique plot with a lot of customizations, matplotlib is still the best choice.
Sveip for å begynne å kode
Import the seaborn library with the sns alias.
Løsning
Takk for tilbakemeldingene dine!
single
Spør AI
Spør AI

Spør om hva du vil, eller prøv ett av de foreslåtte spørsmålene for å starte chatten vår
