Bull vs Bear vs Correction
Veeg om het menu te tonen
Financial media throws around "bull market," "bear market," and "correction" constantly – often interchangeably. They aren't the same thing, and confusing them leads to bad decisions.
Each term has a specific, widely accepted definition based on price movement from a recent peak or trough:
Corrections are common – the S&P 500 experiences one roughly every 1–2 years on average. Bear markets are rarer but far more painful. Bull markets are longer than bear markets historically, which is why long-term investors tend to come out ahead.
The Numbers Behind the Labels
Definitions matter less than the underlying data. Since 1950, the S&P 500 has experienced:
- 27 corrections of −10% or more;
- 13 bear markets of −20% or more;
- Average bear market decline: −36%;
- Average bear market duration: ~14 months;
- Average bull market gain: +180%;
- Average bull market duration: ~60 months.
Bull markets last roughly four times longer than bear markets and produce far larger gains than bear markets erase. This asymmetry is the core argument for staying invested rather than trying to time your exit.

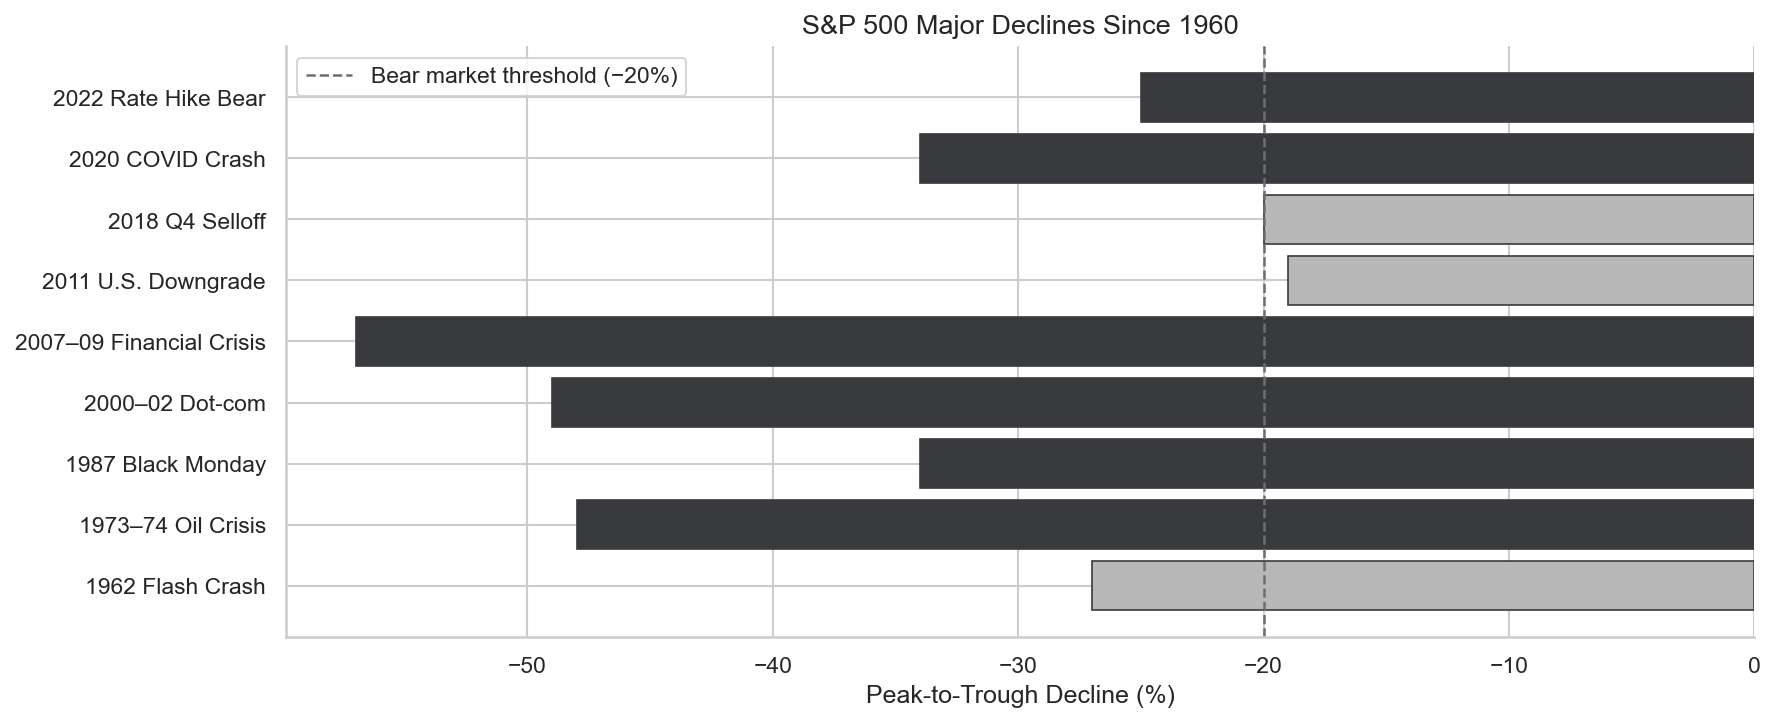
A bear market is a decline of 20% or more from a recent peak, typically accompanied by widespread pessimism and economic contraction. A bull market is a rise of 20% or more from a recent trough, typically accompanied by economic expansion and investor optimism. A correction is a decline of 10–20% – a normal, frequent reset that does not qualify as a bear market.

These thresholds are conventions, not laws. A market that drops 19.9% is not fundamentally different from one that drops 20.1% – but only one gets labeled a bear market. The labels are useful for communication and historical comparison, not for making buy or sell decisions.
1. The S&P 500 drops 18% from its recent peak over three months. How should this be classified?
2. Historically, which statement best describes the relationship between bull and bear markets in the S&P 500?
Bedankt voor je feedback!
Vraag AI

Vraag AI

Vraag wat u wilt of probeer een van de voorgestelde vragen om onze chat te starten.
Bull vs Bear vs Correction
Financial media throws around "bull market," "bear market," and "correction" constantly – often interchangeably. They aren't the same thing, and confusing them leads to bad decisions.
Each term has a specific, widely accepted definition based on price movement from a recent peak or trough:
Corrections are common – the S&P 500 experiences one roughly every 1–2 years on average. Bear markets are rarer but far more painful. Bull markets are longer than bear markets historically, which is why long-term investors tend to come out ahead.
The Numbers Behind the Labels
Definitions matter less than the underlying data. Since 1950, the S&P 500 has experienced:
- 27 corrections of −10% or more;
- 13 bear markets of −20% or more;
- Average bear market decline: −36%;
- Average bear market duration: ~14 months;
- Average bull market gain: +180%;
- Average bull market duration: ~60 months.
Bull markets last roughly four times longer than bear markets and produce far larger gains than bear markets erase. This asymmetry is the core argument for staying invested rather than trying to time your exit.
A bear market is a decline of 20% or more from a recent peak, typically accompanied by widespread pessimism and economic contraction. A bull market is a rise of 20% or more from a recent trough, typically accompanied by economic expansion and investor optimism. A correction is a decline of 10–20% – a normal, frequent reset that does not qualify as a bear market.
These thresholds are conventions, not laws. A market that drops 19.9% is not fundamentally different from one that drops 20.1% – but only one gets labeled a bear market. The labels are useful for communication and historical comparison, not for making buy or sell decisions.
Bedankt voor je feedback!
