Why Visualization Matters?
Veeg om het menu te tonen
In today's fast-paced world, the amount of data continues to grow. Plotting helps turn raw data into insightful visualizations, making it easier to understand the information that matters.
Main applications of plotting are the following:
- Communication: plotting helps convey complex ideas and information to a wide range of audiences;
- Analytics: helpful providing a clear overview of data distribution, relationships, and correlations;
- Decision making: instrumental in creating reports and dashboards that assist in strategic decision-making.
Suppose you run a business, and you would like to look at the sales of your products from January to June. Here is a plot to make everything clear for you:
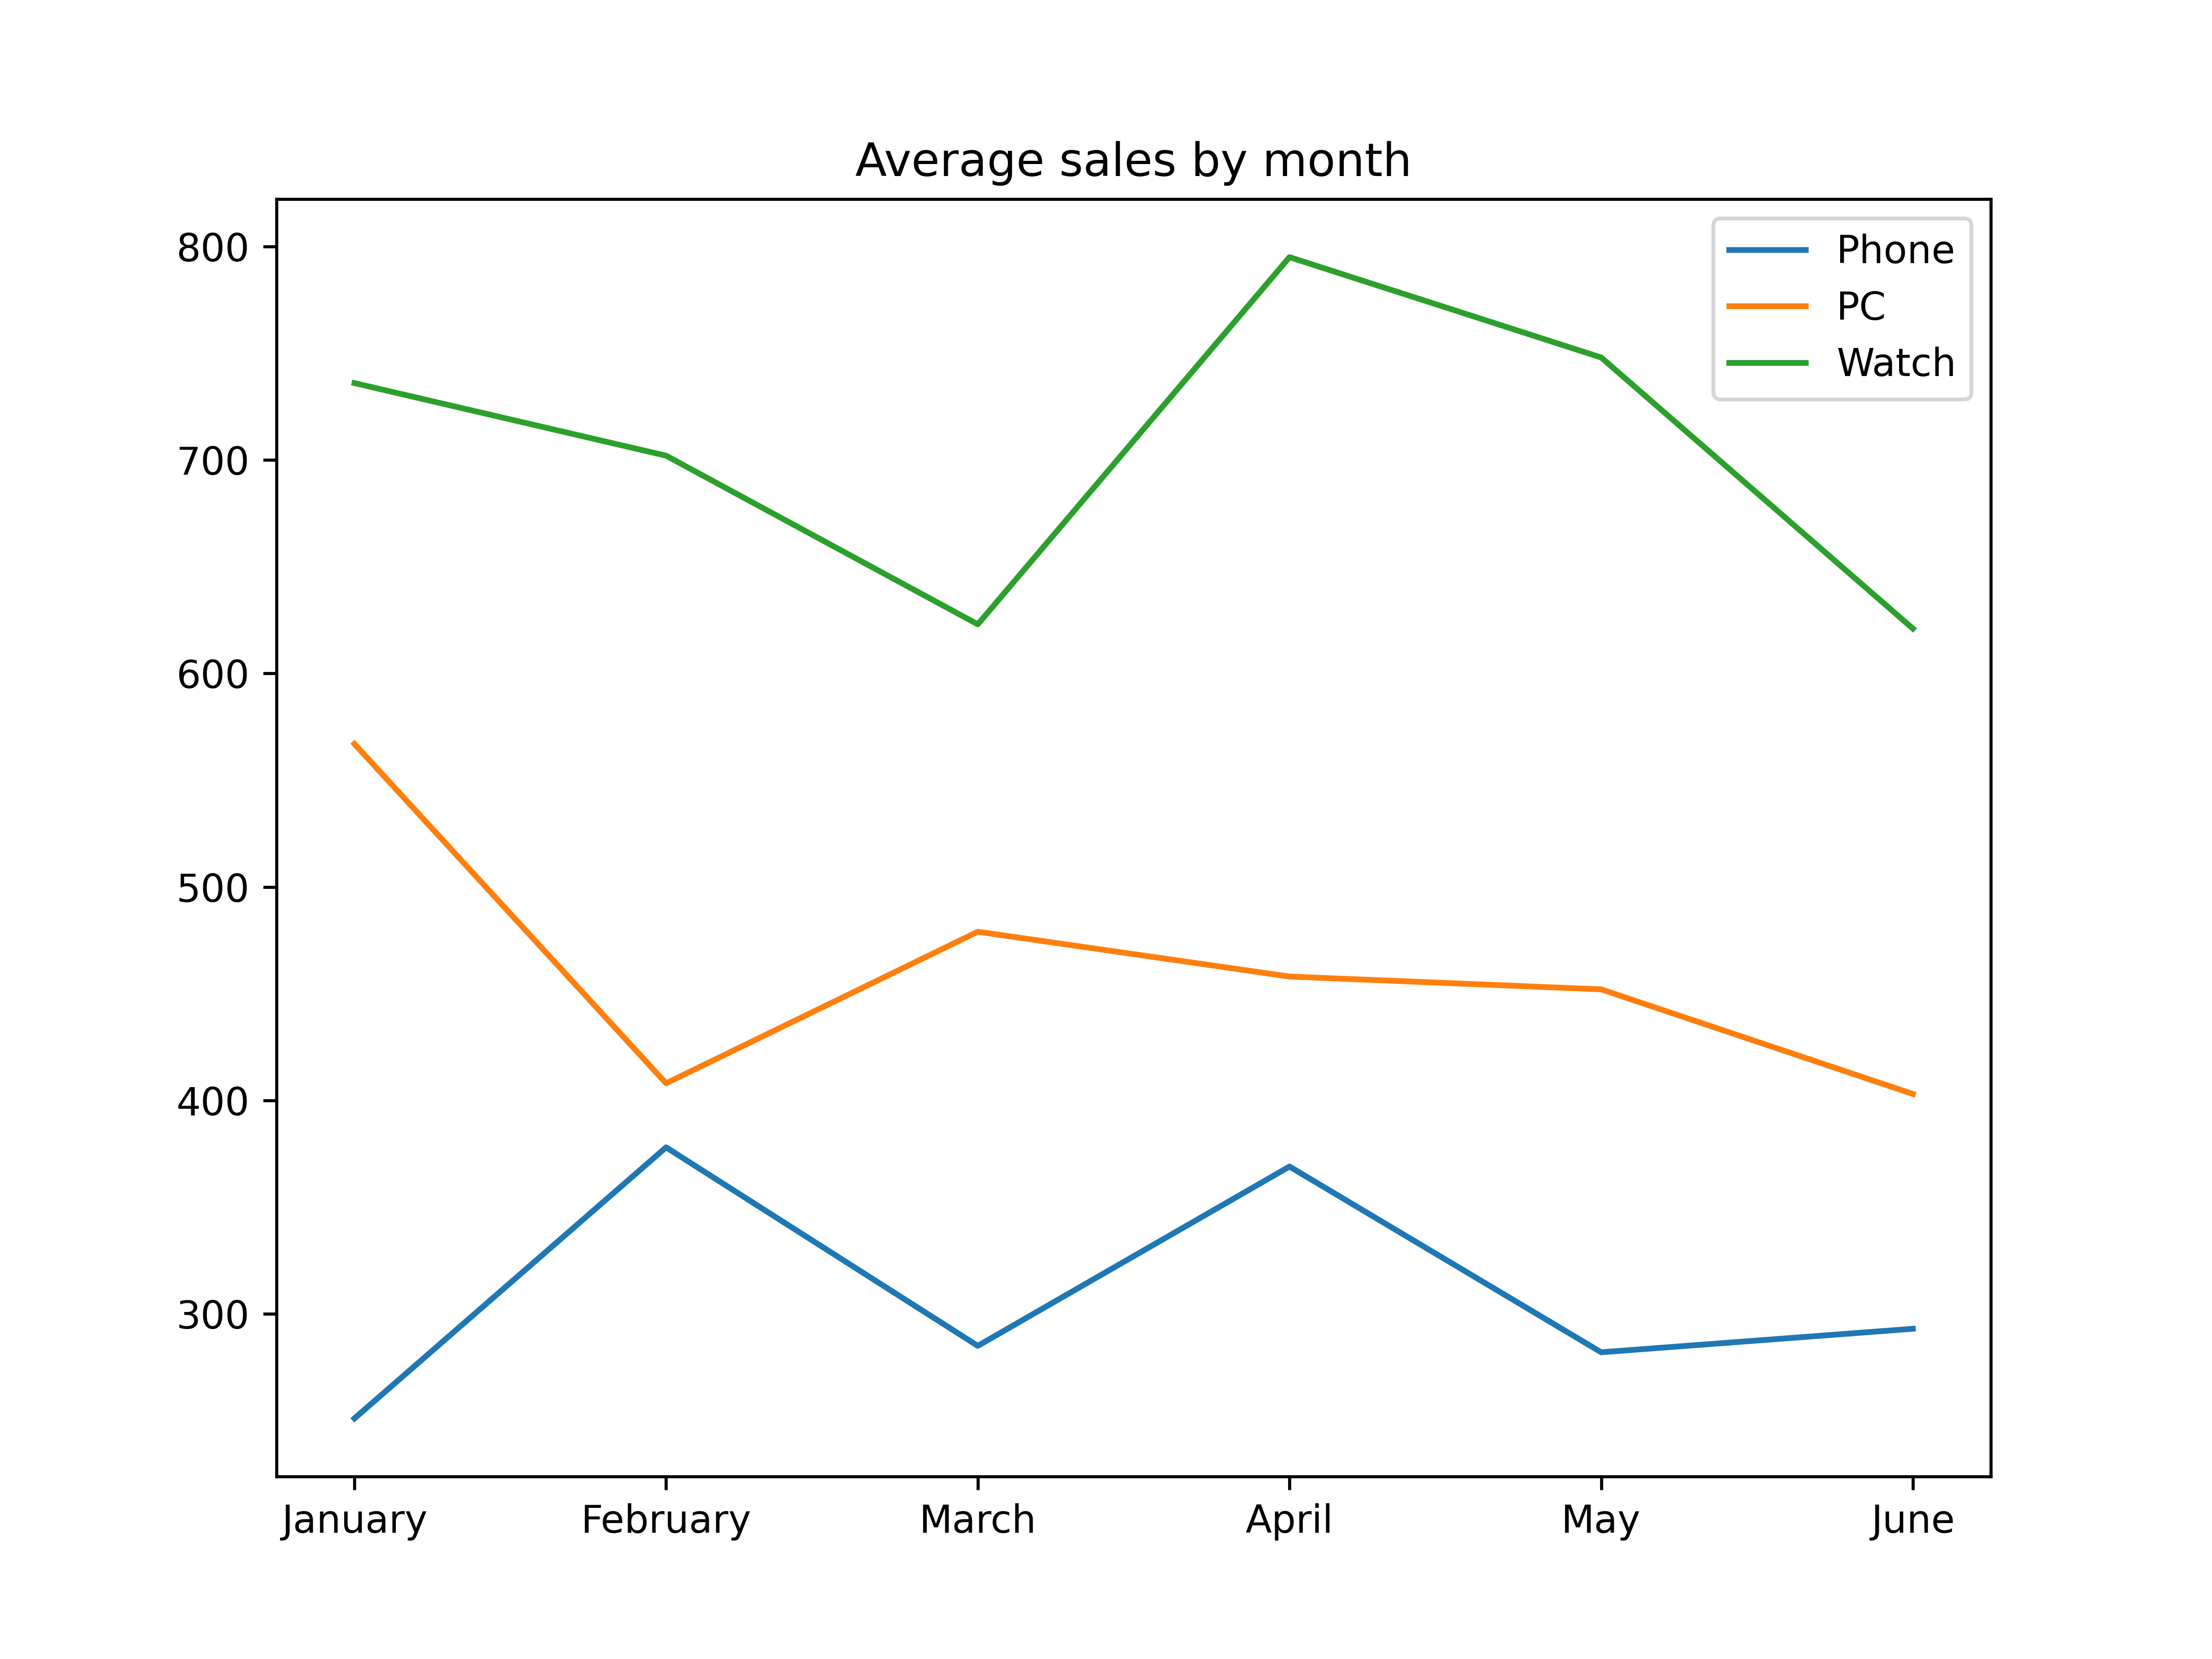
This is an example with artificial data, but it shows the number of sales by month and highlights trends for each product.
For instance, watch sales have clearly decreased in March and June, which means that these months in particular should be analyzed to explain this significant drop in regard to watch sales.
Bedankt voor je feedback!
Vraag AI
Vraag AI

Vraag wat u wilt of probeer een van de voorgestelde vragen om onze chat te starten.
