Sectie 2. Hoofdstuk 2
single
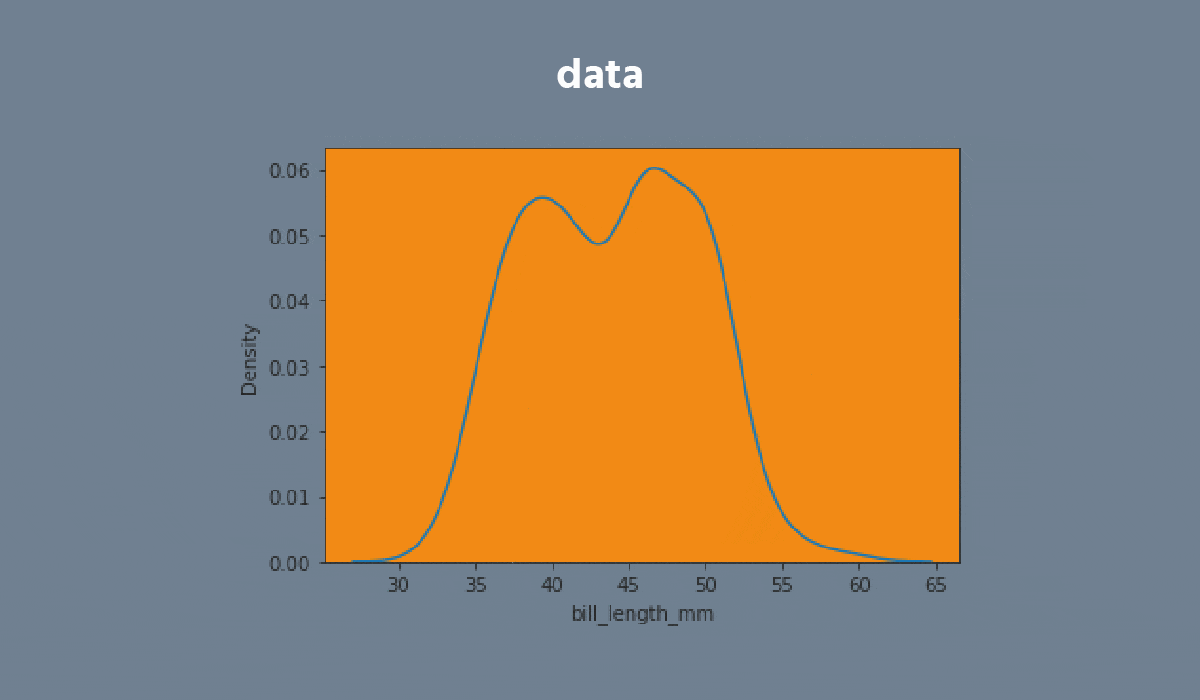
Kdeplot
Veeg om het menu te tonen
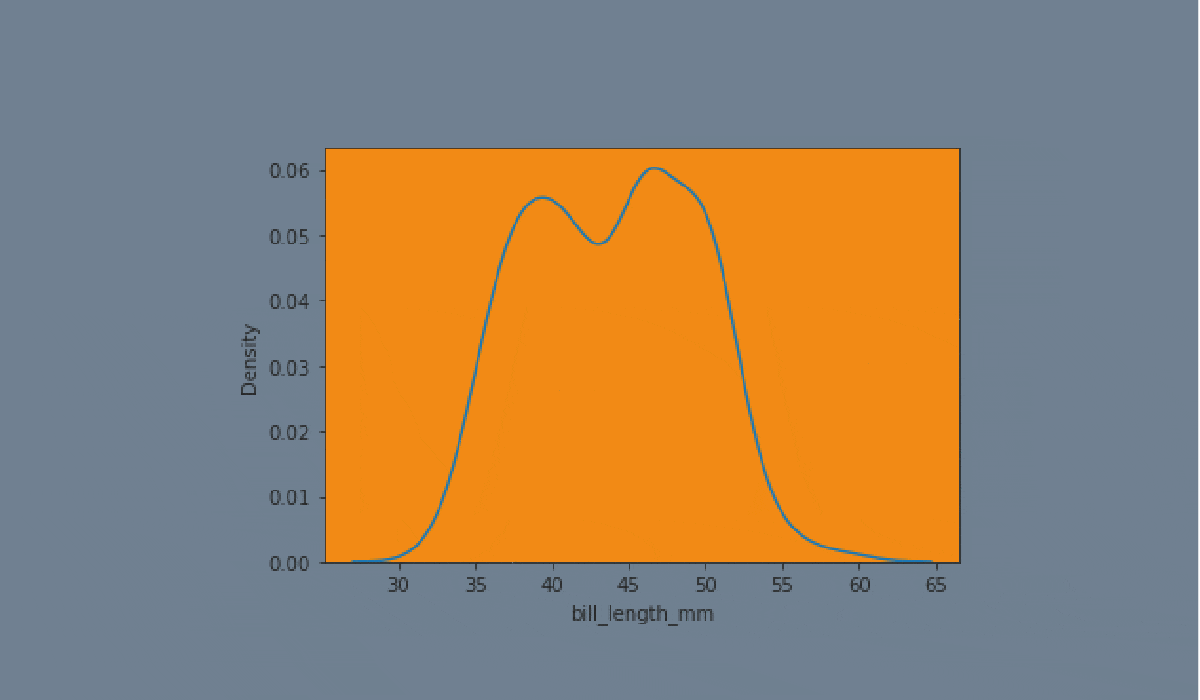
A kdeplot plot is a method for visualizing the distribution of observations in a dataset analogous to a histogram. KDE represents the data using a continuous probability density curve in one or more dimensions.


Taak
Veeg om te beginnen met coderen
- Create the kdeplot using the
seabornlibrary:
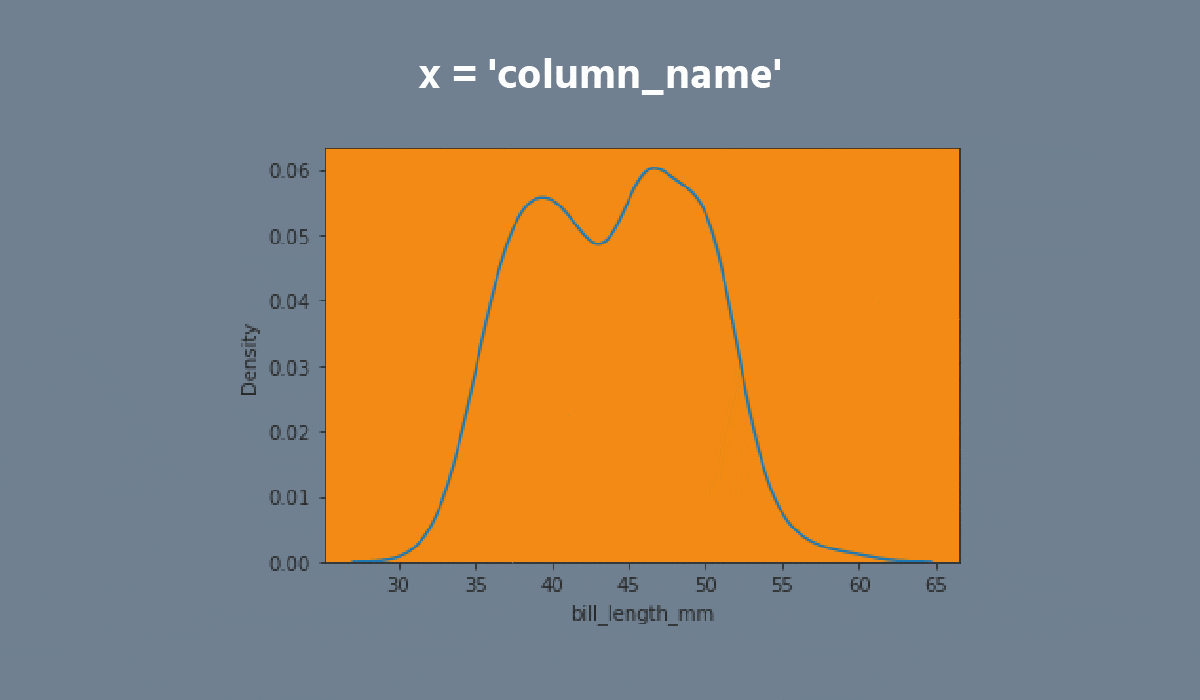
- Set the
xparameter equals the'max_temp'; - Set the
hueparameter equals the'month'; - Set the
multipleparameter equals the'stack'; - Disable the
legend; - Add the filling;
- Set the data;
- Display the plot.
Oplossing
Was alles duidelijk?
Bedankt voor je feedback!
Sectie 2. Hoofdstuk 2
single
Vraag AI
Vraag AI

Vraag wat u wilt of probeer een van de voorgestelde vragen om onze chat te starten.
