single
Gráfico de Contagem
Deslize para mostrar o menu
Um countplot é um gráfico que cria colunas (barras) representando o número de entradas para cada categoria de uma lista categórica. Também pode ser considerado como um histograma de uma variável categórica.
Aqui, cada coluna representa o número de passageiros do Titanic de cada classe. Você já deve ter notado que esse gráfico é muito semelhante ao gráfico de barras. De fato, trata-se de um tipo específico de gráfico de barras que representa a frequência de cada categoria.
Ainda é necessário importar o módulo pyplot do matplotlib e utilizar a função plt.show() para exibir os gráficos criados com o seaborn.
Para criar um countplot com o seaborn, utilize a função countplot(). Existem várias opções para passar os dados para essa função.
Passando um Array 1D
A primeira opção é simplesmente passar o valor para o parâmetro x, que pode ser algum tipo de array:
12345678import seaborn as sns import matplotlib.pyplot as plt fruits = ['apple', 'banana', 'orange', 'apple', 'apple', 'apple', 'orange', 'banana', 'banana', 'banana', 'banana', 'banana', 'banana', 'banana'] sns.countplot(x=fruits) plt.show()
A função conta cada elemento único na lista e cria uma coluna com a altura correspondente.
O parâmetro y pode ser utilizado em vez de x para alterar a orientação do gráfico de vertical para horizontal.
Passando um Objeto 2D
Outra opção é utilizar o parâmetro data combinado com o parâmetro x ou y. Essa abordagem é adequada para trabalhar com pandas do DataFrame. Você pode passar uma lista de arrays ou um DataFrame como valor para data. Para x ou y, é possível passar o nome da coluna no DataFrame.
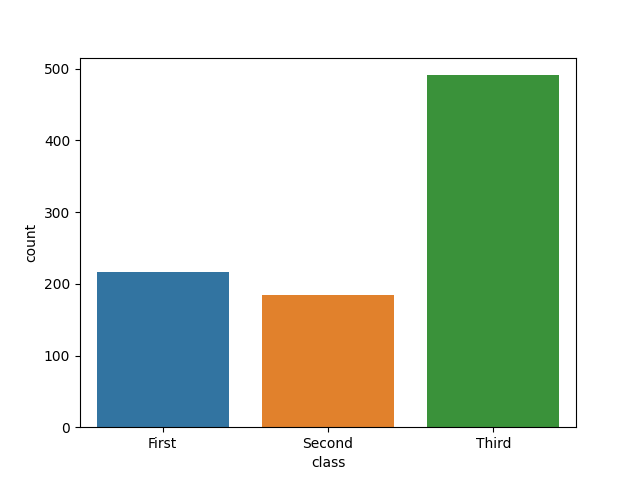
123456789import seaborn as sns import matplotlib.pyplot as plt # Loading a built-in dataset of the Titanic passengers titanic_df = sns.load_dataset('titanic') sns.countplot(data=titanic_df, x='class') plt.show()
Neste exemplo, a função cria um countplot utilizando a coluna 'class' do DataFrame Titanic, mostrando quantas entradas existem para cada valor único nessa coluna.
Deslize para começar a programar
- Importe a biblioteca
seaborncom o aliassns. - Importe o módulo
matplotlib.pyplotcom o aliasplt. - Utilize a função correta para criar um countplot.
- Use
diamondscomo o primeiro argumento para especificar oDataFrame. - Utilize a coluna
'cut'do DataFramediamondscomo as categorias para o countplot e exiba as categorias no eixo y por meio do segundo argumento. - Exiba o gráfico utilizando a função apropriada.
Solução
Obrigado pelo seu feedback!
single
Pergunte à IA
Pergunte à IA

Pergunte o que quiser ou experimente uma das perguntas sugeridas para iniciar nosso bate-papo
