 Displot
Note
displot=FacetGrid(we will study this plot later) +histplot/kdeplot/ecdfplot
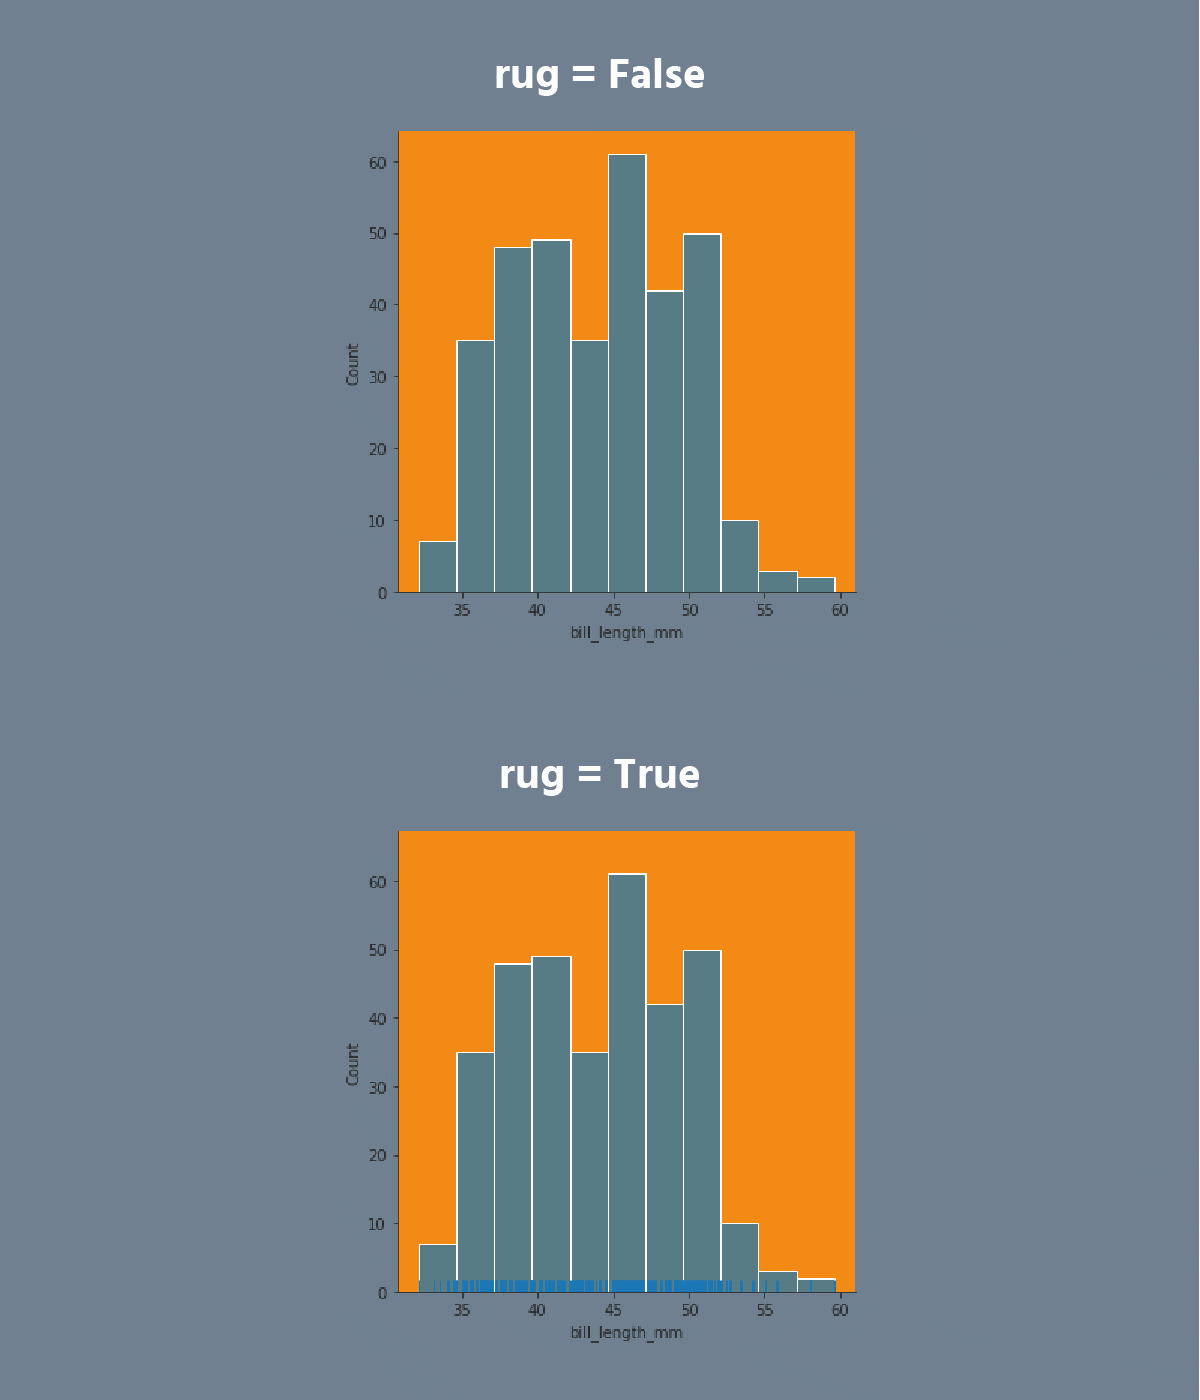
The displot provides access to several approaches for visualizing the univariate or bivariate distribution of data, including subsets of data defined by semantic mapping and faceting across multiple subplots.
The kind parameter selects the approach to use: histplot, kdeplot, ecdfplot.


Swipe to start coding
- Set the
'darkgrid'style. - Create the
displotusing theseabornlibrary:
- Set the
xparameter equals the'carat'; - Set the
hueparameter equals the'cut'; - Set the
colparameter equals the'color'; - Set the
kindparameter equals the'kde'; - Set the
multipleparameter equals the'fill'; - Set the
paletteequals the'viridis'; - Set the data.
Lösning
Tack för dina kommentarer!
single
Fråga AI
Fråga AI

Fråga vad du vill eller prova någon av de föreslagna frågorna för att starta vårt samtal

Fantastiskt!
Completion betyg förbättrat till 4.35 Displot
Svep för att visa menyn
Note
displot=FacetGrid(we will study this plot later) +histplot/kdeplot/ecdfplot
The displot provides access to several approaches for visualizing the univariate or bivariate distribution of data, including subsets of data defined by semantic mapping and faceting across multiple subplots.
The kind parameter selects the approach to use: histplot, kdeplot, ecdfplot.


Swipe to start coding
- Set the
'darkgrid'style. - Create the
displotusing theseabornlibrary:
- Set the
xparameter equals the'carat'; - Set the
hueparameter equals the'cut'; - Set the
colparameter equals the'color'; - Set the
kindparameter equals the'kde'; - Set the
multipleparameter equals the'fill'; - Set the
paletteequals the'viridis'; - Set the data.
Lösning
Tack för dina kommentarer!
single