Avsnitt 5. Kapitel 3
single
JointGrid
Svep för att visa menyn
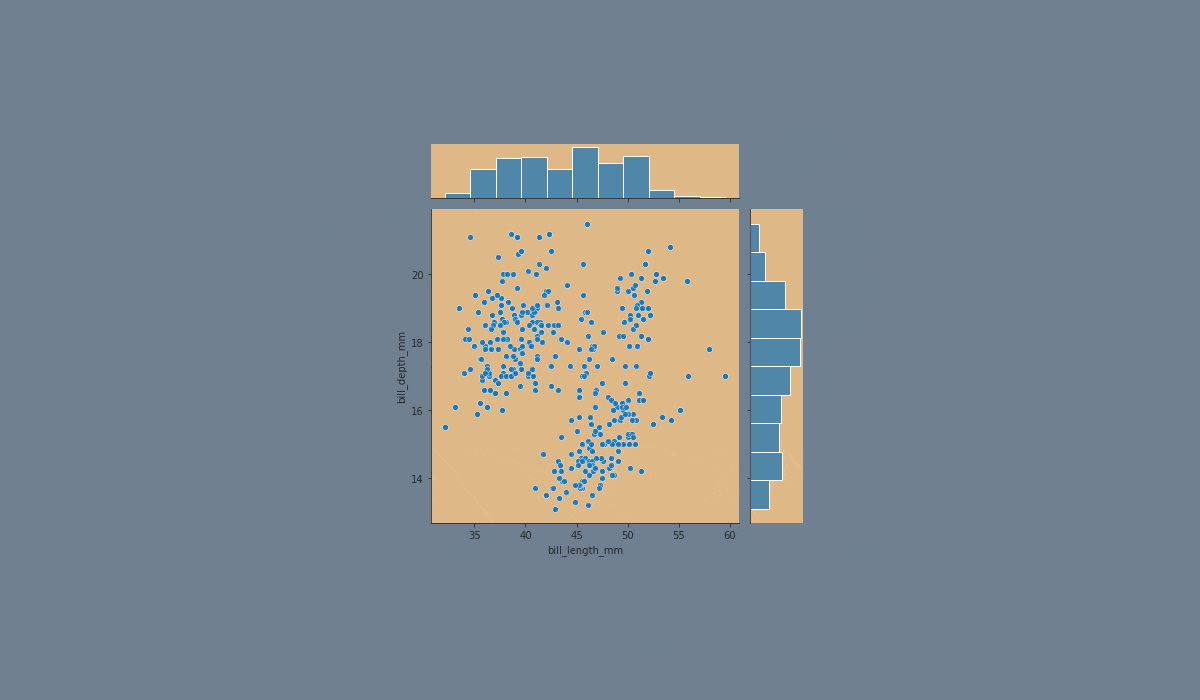
JointGrid is a figure-level function, when the function is called a JointGrid object is instantiated. The function creates a JointGrid object consisting of three axes objects but does not plot anything on it.


import pandas as pd
import seaborn as sns
from matplotlib import pyplot as plt

df = pd.read_csv('filename.csv')

# Creating the JointGrid variable
g = sns.JointGrid(x = 'column_name', y = 'column_name', data = df)

# Creating the inside plot
g.plot_joint(sns.scatterplot)

# Creating the outside plot
g.plot_marginals(sns.histplot)

plt.show()
Uppgift
Svep för att börja koda
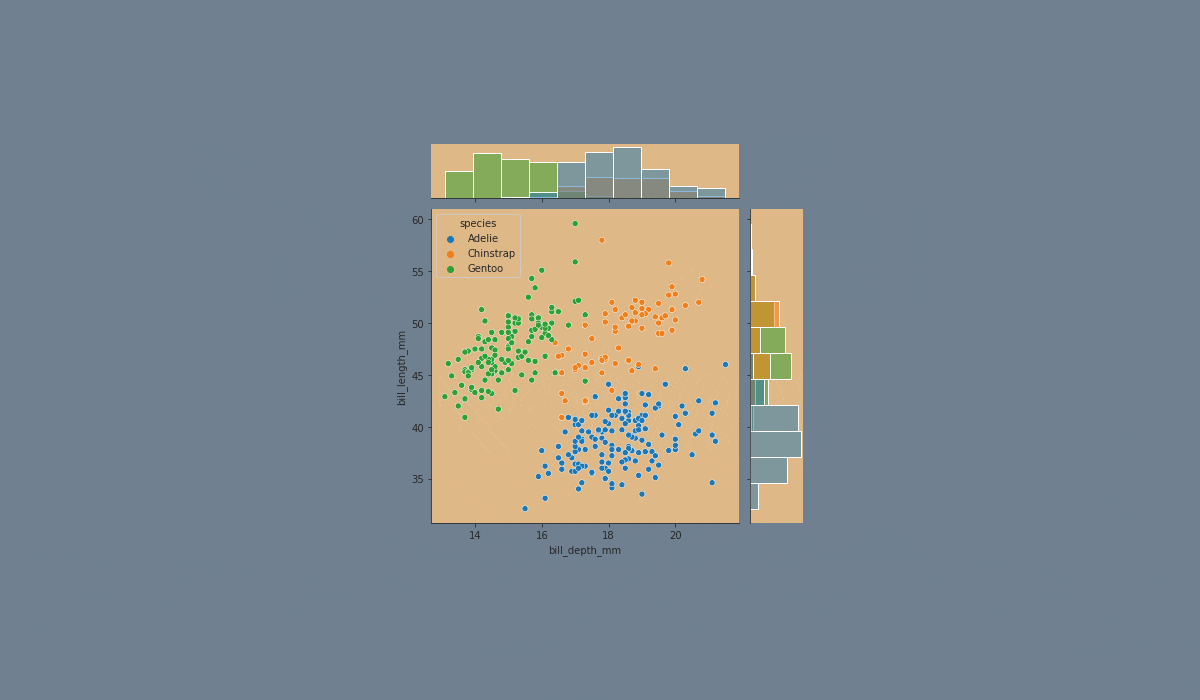
- Set the
'ticks'style with the'lightcyan'figure.facecolor. - Create a
JointGridvariableg:
- Set the
xparameter equals the'bill_length_mm'; - Set the
yparameter equals the'bill_depth_mm'; - Set the
hueparameter equals the'species'; - Set the
'viridis'palette; - Set the data.
Set the inside plot using the .plot_joint() function using the g variable:
- Create a
scatterplotusing theseaborn; - Set the
alphaparameter equals0.5; - Set the
'pink'edgecolorparameter; - Set the
linewidthparameter equals1.
Set the outside plot using the .plot_marginals() function:
- Create the
histplotusing theseaborn; - Add the
kdeparameter.
Lösning
Var allt tydligt?
Tack för dina kommentarer!
Avsnitt 5. Kapitel 3
single
Fråga AI
Fråga AI

Fråga vad du vill eller prova någon av de föreslagna frågorna för att starta vårt samtal
