Notice: This page requires JavaScript to function properly.
Please enable JavaScript in your browser settings or update your browser.
Displot | Distributions of Data
Deep Dive into the seaborn Visualization
course content

Зміст курсу

Deep Dive into the seaborn Visualization

Deep Dive into the seaborn Visualization

1. Light Start
2. Distributions of Data
3. Categorical Plot Types
4. Matrix Plots
5. Multi-Plot Grids
6. Regression Models

bookDisplot

Note

displot = FacetGrid(we will study this plot later) + histplot/kdeplot/ecdfplot

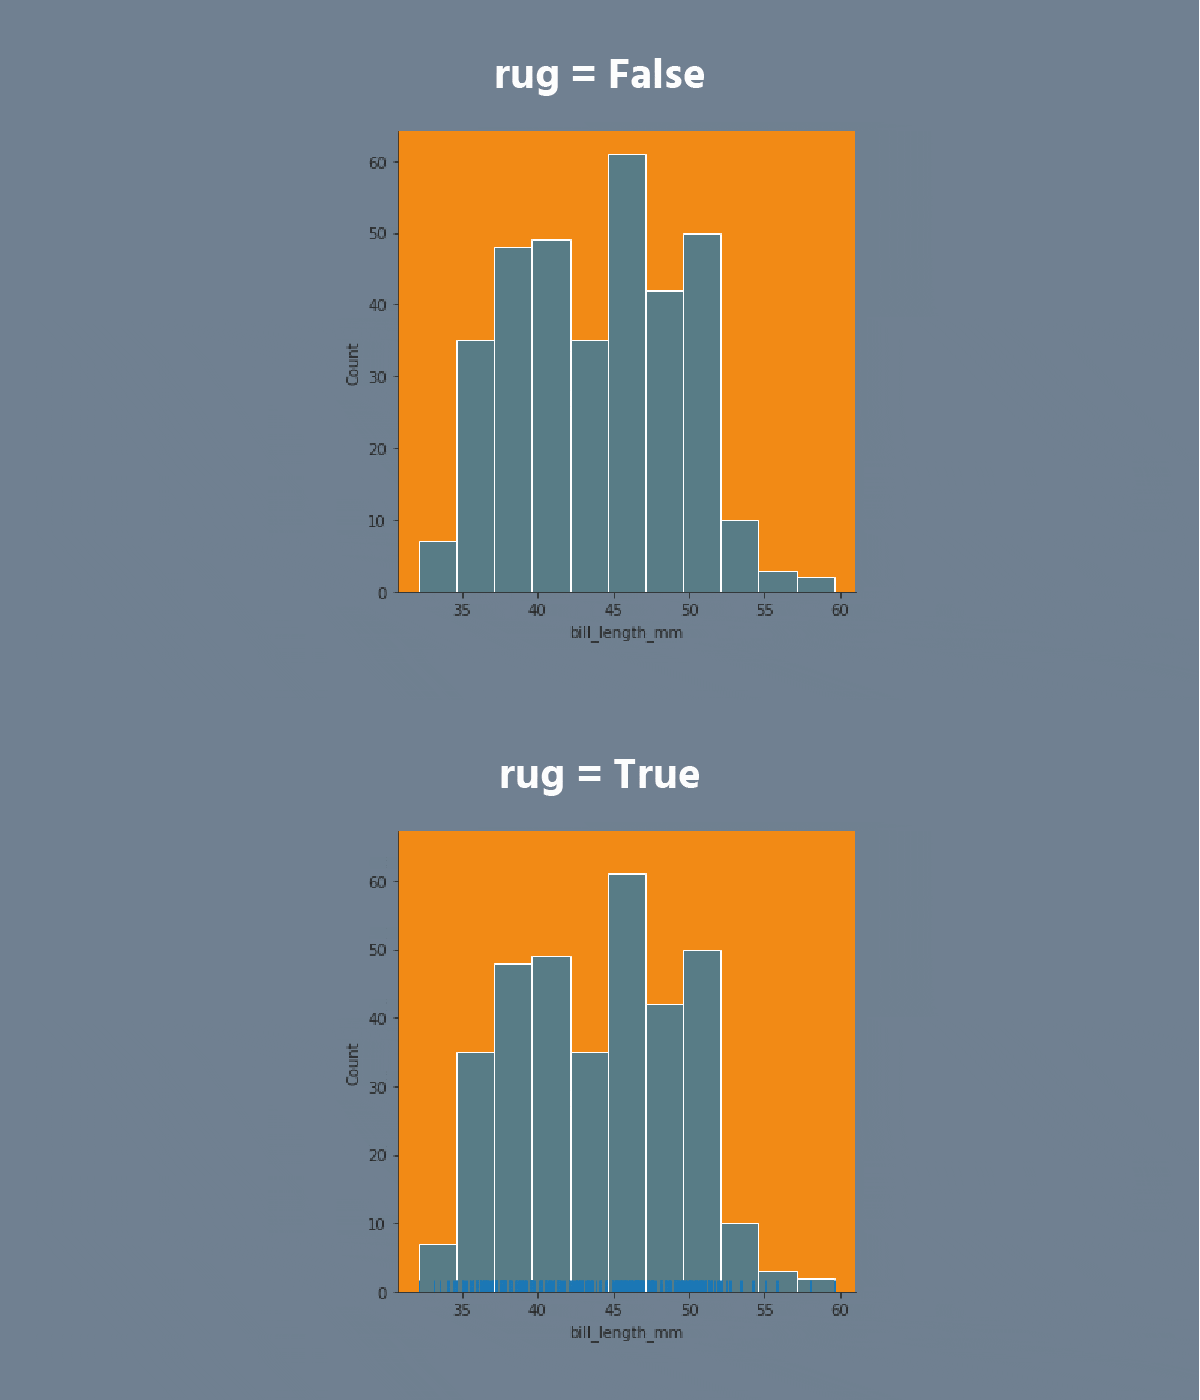
The displot provides access to several approaches for visualizing the univariate or bivariate distribution of data, including subsets of data defined by semantic mapping and faceting across multiple subplots.

The kind parameter selects the approach to use: histplot, kdeplot, ecdfplot.

carousel-imgcarousel-imgcarousel-imgcarousel-imgcarousel-imgcarousel-imgcarousel-imgcarousel-imgcarousel-imgcarousel-img
Завдання
test

Swipe to show code editor

  1. Set the 'darkgrid' style.
  2. Create the displot using the seaborn library:
  • Set the x parameter equals the 'carat';
  • Set the hue parameter equals the 'cut';
  • Set the col parameter equals the 'color';
  • Set the kind parameter equals the 'kde';
  • Set the multiple parameter equals the 'fill';
  • Set the palette equals the 'viridis';
  • Set the data.

Switch to desktopПерейдіть на комп'ютер для реальної практикиПродовжуйте з того місця, де ви зупинились, використовуючи один з наведених нижче варіантів
Все було зрозуміло?

Як ми можемо покращити це?

Дякуємо за ваш відгук!

Секція 2. Розділ 6
toggle bottom row

bookDisplot

Note

displot = FacetGrid(we will study this plot later) + histplot/kdeplot/ecdfplot

The displot provides access to several approaches for visualizing the univariate or bivariate distribution of data, including subsets of data defined by semantic mapping and faceting across multiple subplots.

The kind parameter selects the approach to use: histplot, kdeplot, ecdfplot.

carousel-imgcarousel-imgcarousel-imgcarousel-imgcarousel-imgcarousel-imgcarousel-imgcarousel-imgcarousel-imgcarousel-img
Завдання
test

Swipe to show code editor

  1. Set the 'darkgrid' style.
  2. Create the displot using the seaborn library:
  • Set the x parameter equals the 'carat';
  • Set the hue parameter equals the 'cut';
  • Set the col parameter equals the 'color';
  • Set the kind parameter equals the 'kde';
  • Set the multiple parameter equals the 'fill';
  • Set the palette equals the 'viridis';
  • Set the data.

Switch to desktopПерейдіть на комп'ютер для реальної практикиПродовжуйте з того місця, де ви зупинились, використовуючи один з наведених нижче варіантів
Все було зрозуміло?

Як ми можемо покращити це?

Дякуємо за ваш відгук!

Секція 2. Розділ 6
toggle bottom row

bookDisplot

Note

displot = FacetGrid(we will study this plot later) + histplot/kdeplot/ecdfplot

The displot provides access to several approaches for visualizing the univariate or bivariate distribution of data, including subsets of data defined by semantic mapping and faceting across multiple subplots.

The kind parameter selects the approach to use: histplot, kdeplot, ecdfplot.

carousel-imgcarousel-imgcarousel-imgcarousel-imgcarousel-imgcarousel-imgcarousel-imgcarousel-imgcarousel-imgcarousel-img
Завдання
test

Swipe to show code editor

  1. Set the 'darkgrid' style.
  2. Create the displot using the seaborn library:
  • Set the x parameter equals the 'carat';
  • Set the hue parameter equals the 'cut';
  • Set the col parameter equals the 'color';
  • Set the kind parameter equals the 'kde';
  • Set the multiple parameter equals the 'fill';
  • Set the palette equals the 'viridis';
  • Set the data.

Switch to desktopПерейдіть на комп'ютер для реальної практикиПродовжуйте з того місця, де ви зупинились, використовуючи один з наведених нижче варіантів
Все було зрозуміло?

Як ми можемо покращити це?

Дякуємо за ваш відгук!

Note

displot = FacetGrid(we will study this plot later) + histplot/kdeplot/ecdfplot

The displot provides access to several approaches for visualizing the univariate or bivariate distribution of data, including subsets of data defined by semantic mapping and faceting across multiple subplots.

The kind parameter selects the approach to use: histplot, kdeplot, ecdfplot.

carousel-imgcarousel-imgcarousel-imgcarousel-imgcarousel-imgcarousel-imgcarousel-imgcarousel-imgcarousel-imgcarousel-img
Завдання
test

Swipe to show code editor

  1. Set the 'darkgrid' style.
  2. Create the displot using the seaborn library:
  • Set the x parameter equals the 'carat';
  • Set the hue parameter equals the 'cut';
  • Set the col parameter equals the 'color';
  • Set the kind parameter equals the 'kde';
  • Set the multiple parameter equals the 'fill';
  • Set the palette equals the 'viridis';
  • Set the data.

Switch to desktopПерейдіть на комп'ютер для реальної практикиПродовжуйте з того місця, де ви зупинились, використовуючи один з наведених нижче варіантів
Секція 2. Розділ 6
Switch to desktopПерейдіть на комп'ютер для реальної практикиПродовжуйте з того місця, де ви зупинились, використовуючи один з наведених нижче варіантів
We're sorry to hear that something went wrong. What happened?
some-alt