 Heatmap
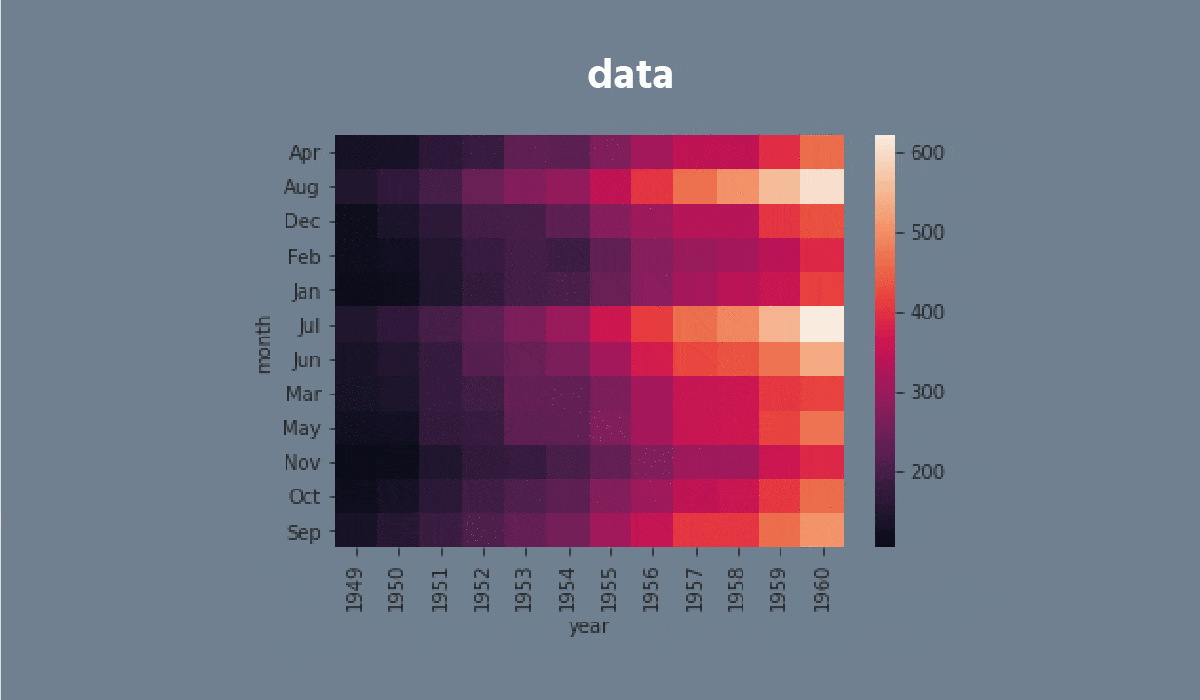
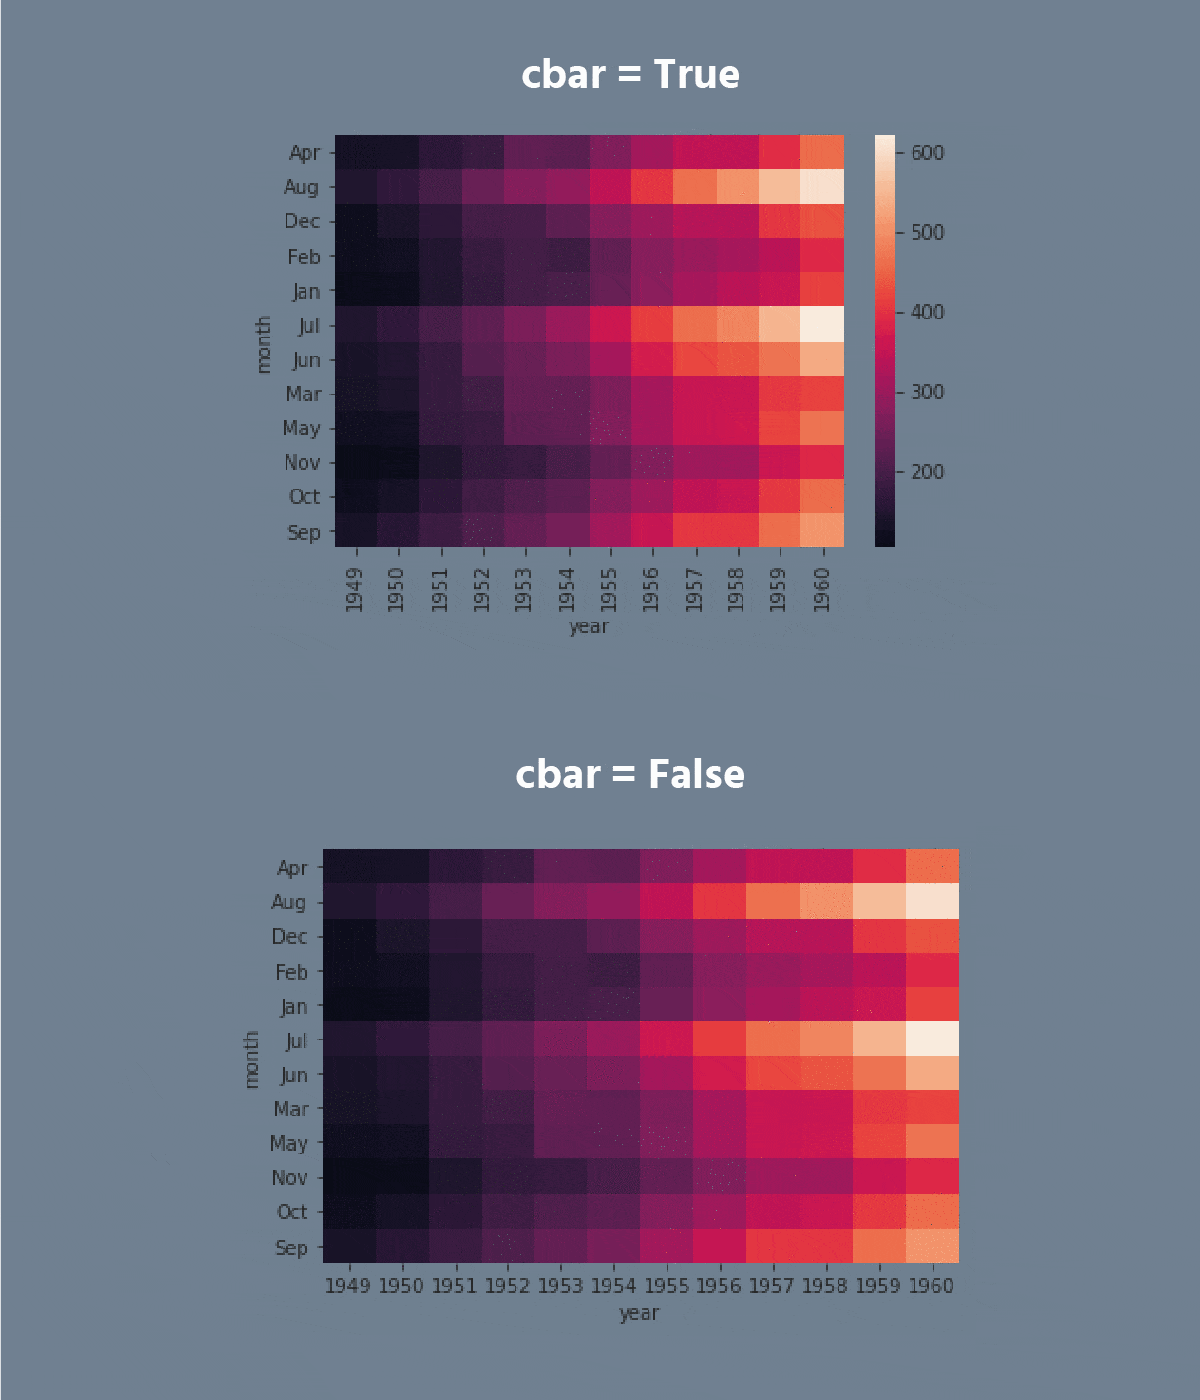
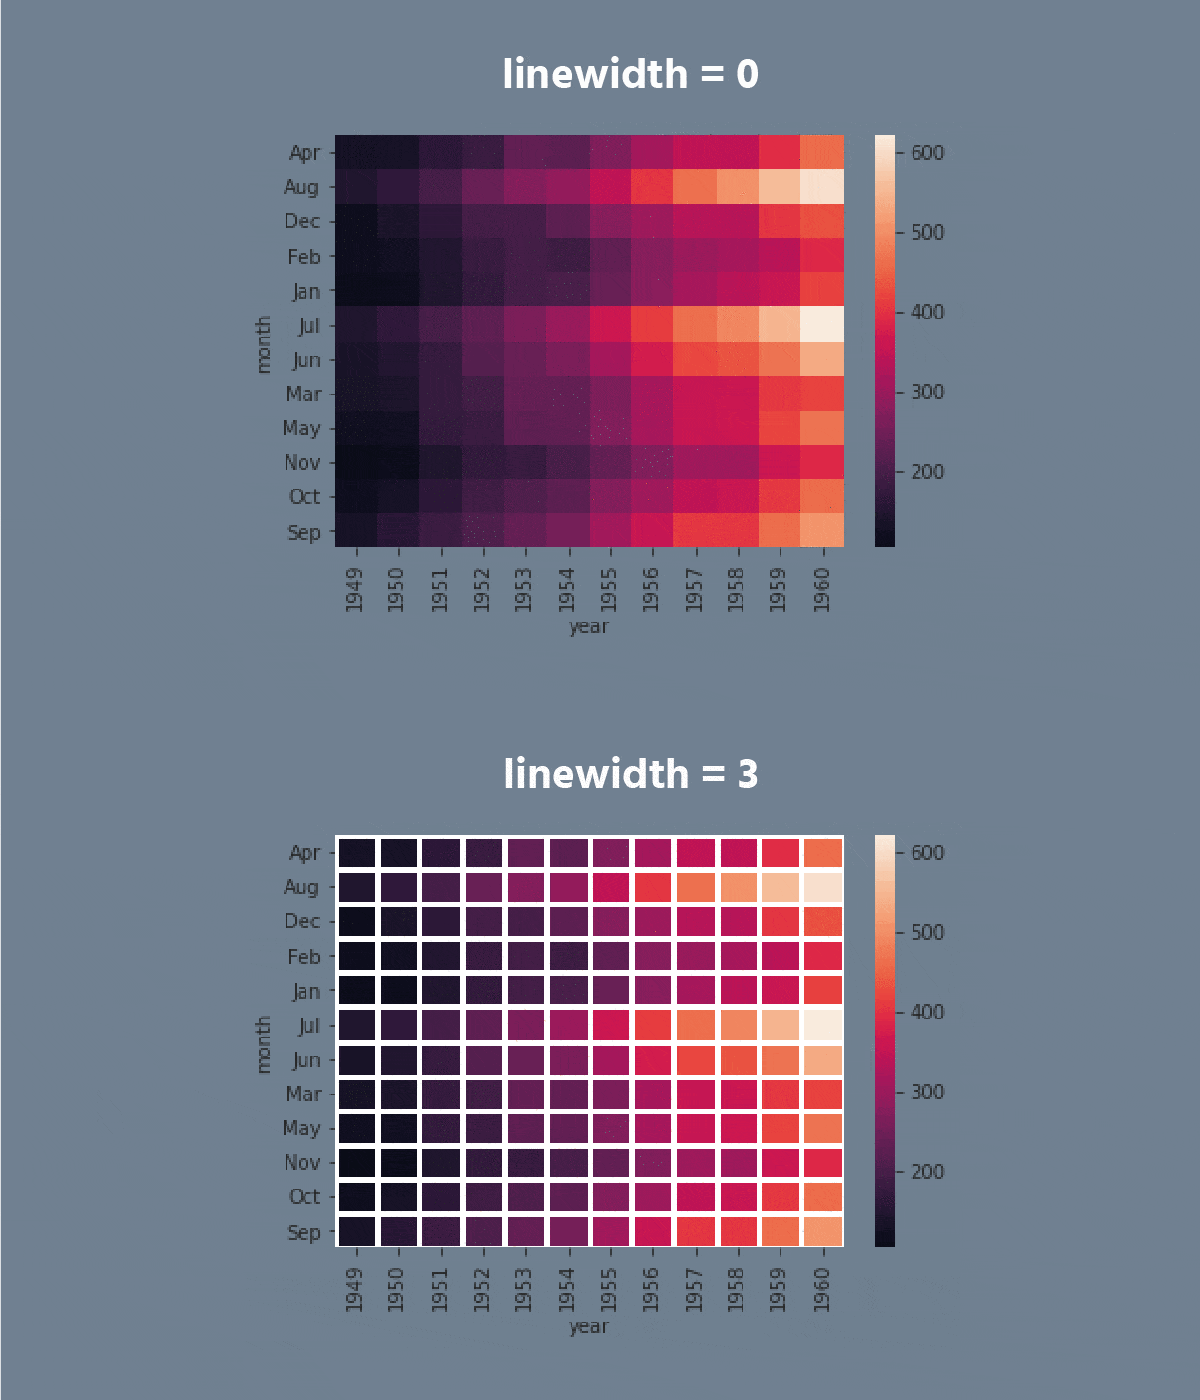
A heatmap is a plot of rectangular data as a color-encoded matrix. As a parameter, it takes a 2D dataset. That dataset can be coerced into an ndarray.
This is a great way to visualize data because it can show the relation between variables, including time. For instance, the number of flights through the years.




Swipe to start coding
- Set the
'ticks'style with the'seagreen'figure.facecolor. - Create the
heatmapusing theseabornlibrary:
- Add the data for the
heatmap. You only need to input the name of the DataFrame (withoutdata = ...); - Set the
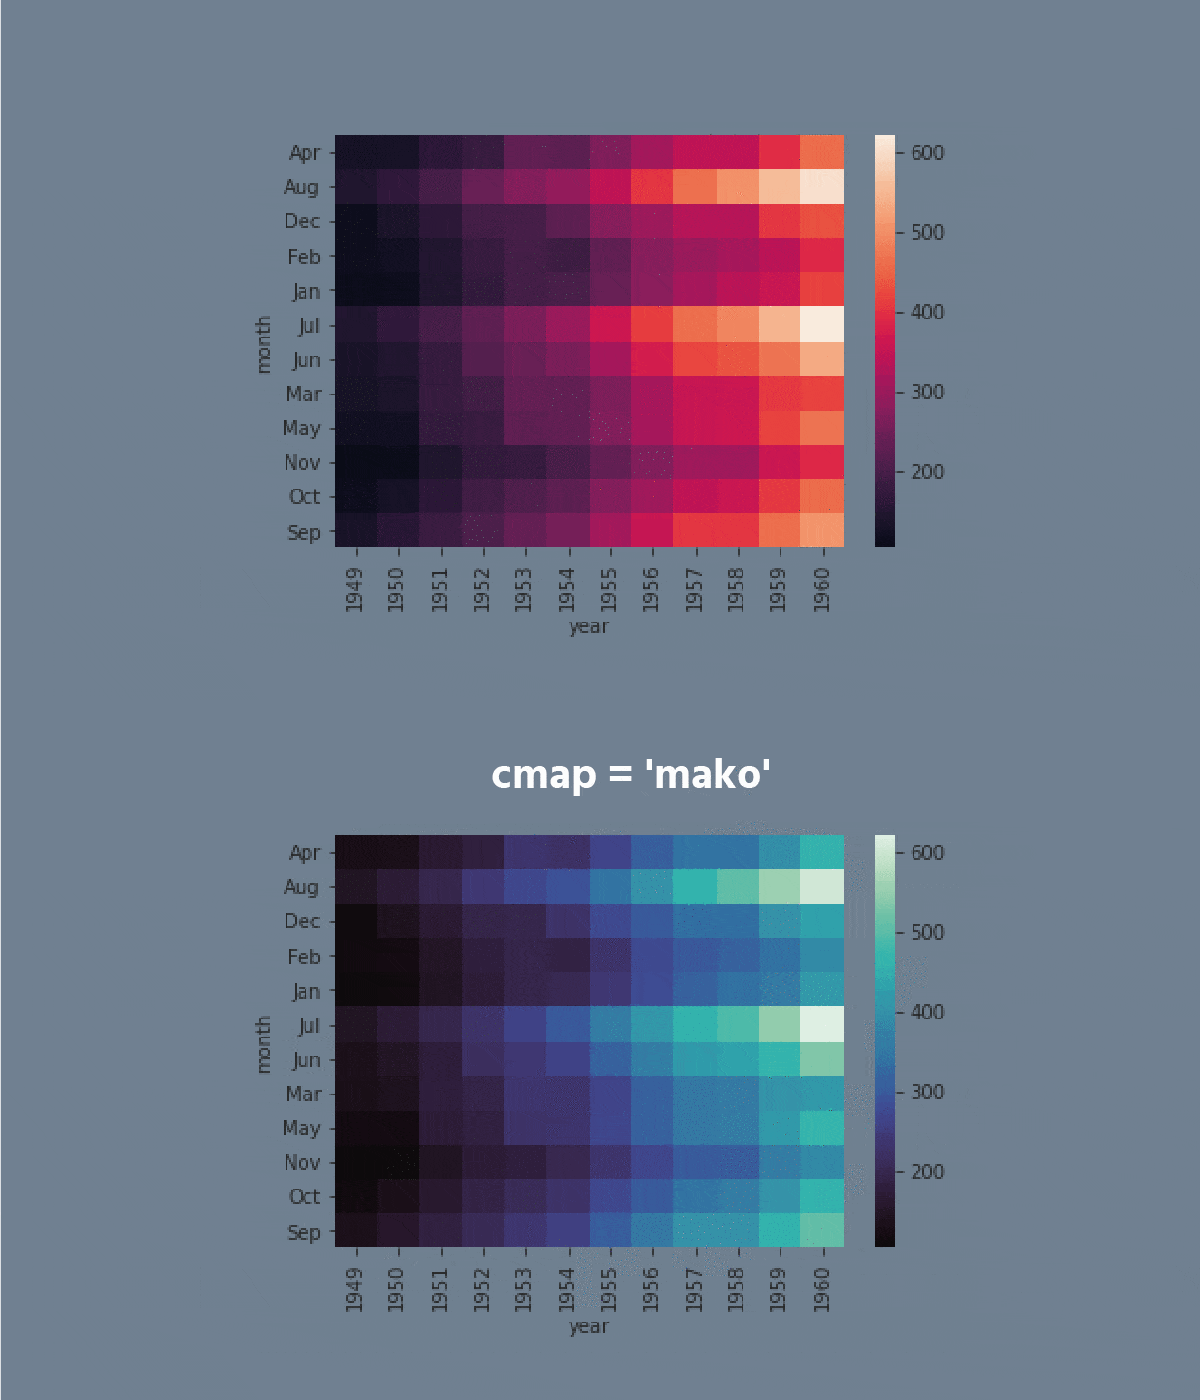
'viridis'cmapparameter; - Add the
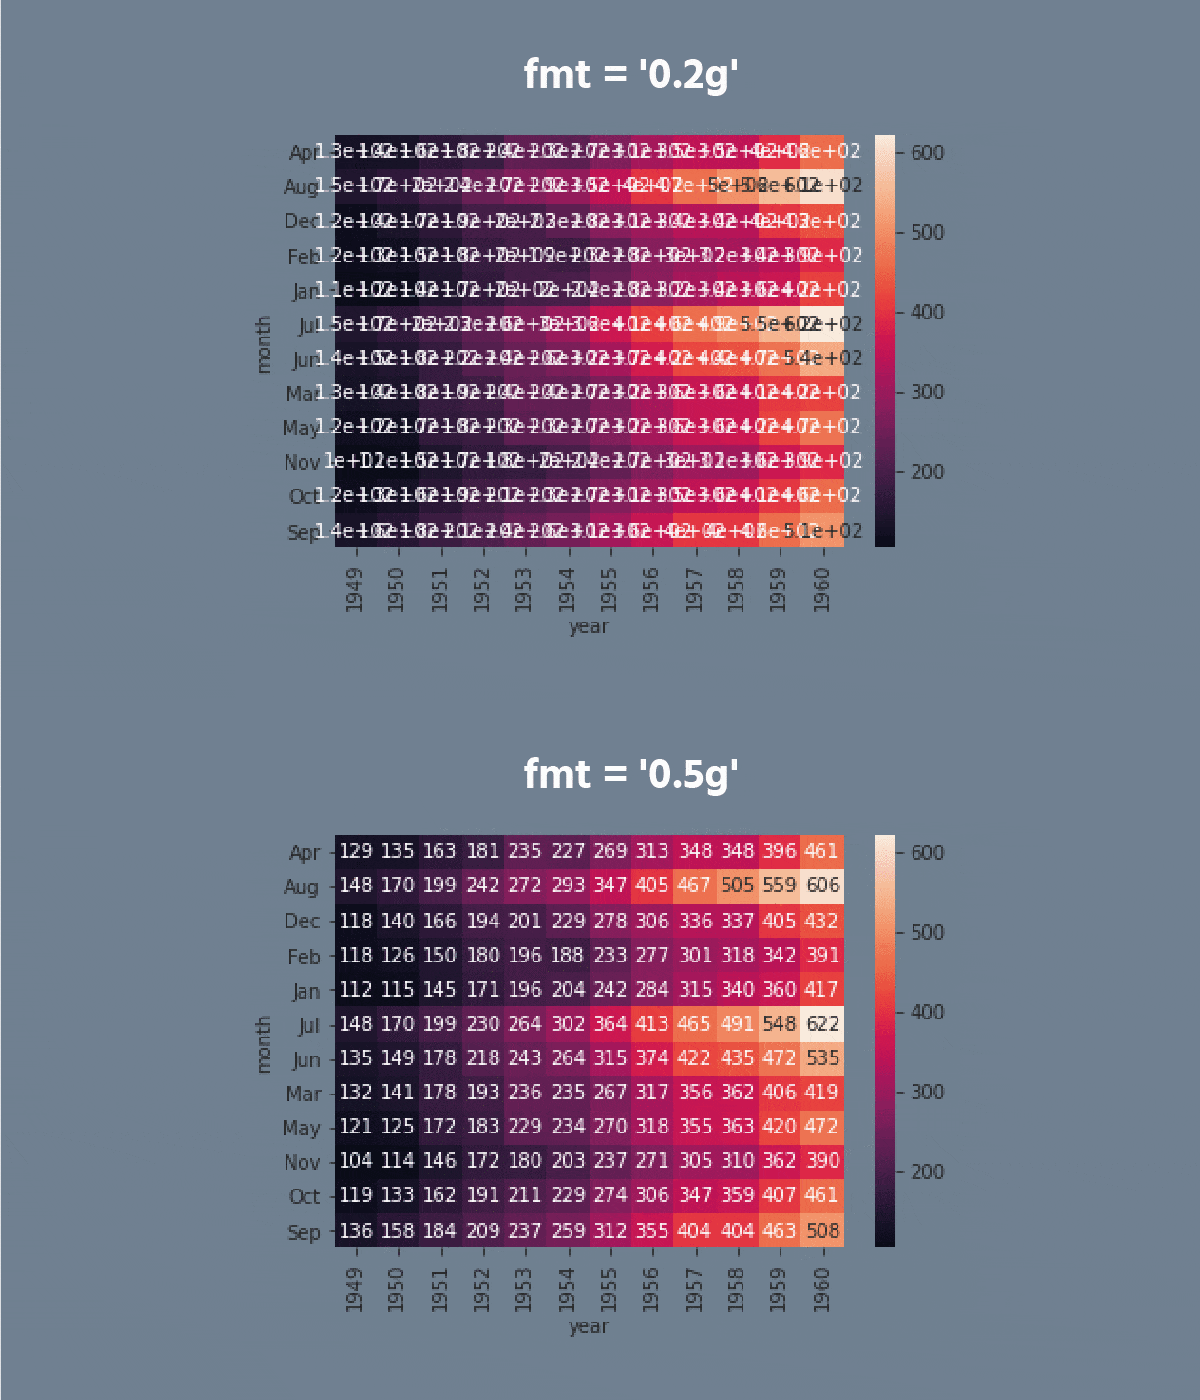
annotparameter; - Set the
fmtparameter equals the'0.99g'; - Set the
linecolorparameter equals the'plum'; - Display the plot.
Рішення
Дякуємо за ваш відгук!
single
Запитати АІ
Запитати АІ

Запитайте про що завгодно або спробуйте одне із запропонованих запитань, щоб почати наш чат

Чудово!
Completion показник покращився до 4.35 Heatmap
Свайпніть щоб показати меню
A heatmap is a plot of rectangular data as a color-encoded matrix. As a parameter, it takes a 2D dataset. That dataset can be coerced into an ndarray.
This is a great way to visualize data because it can show the relation between variables, including time. For instance, the number of flights through the years.


Swipe to start coding
- Set the
'ticks'style with the'seagreen'figure.facecolor. - Create the
heatmapusing theseabornlibrary:
- Add the data for the
heatmap. You only need to input the name of the DataFrame (withoutdata = ...); - Set the
'viridis'cmapparameter; - Add the
annotparameter; - Set the
fmtparameter equals the'0.99g'; - Set the
linecolorparameter equals the'plum'; - Display the plot.
Рішення
Дякуємо за ваш відгук!
single