Analyzing Test Results
Swipe to show menu
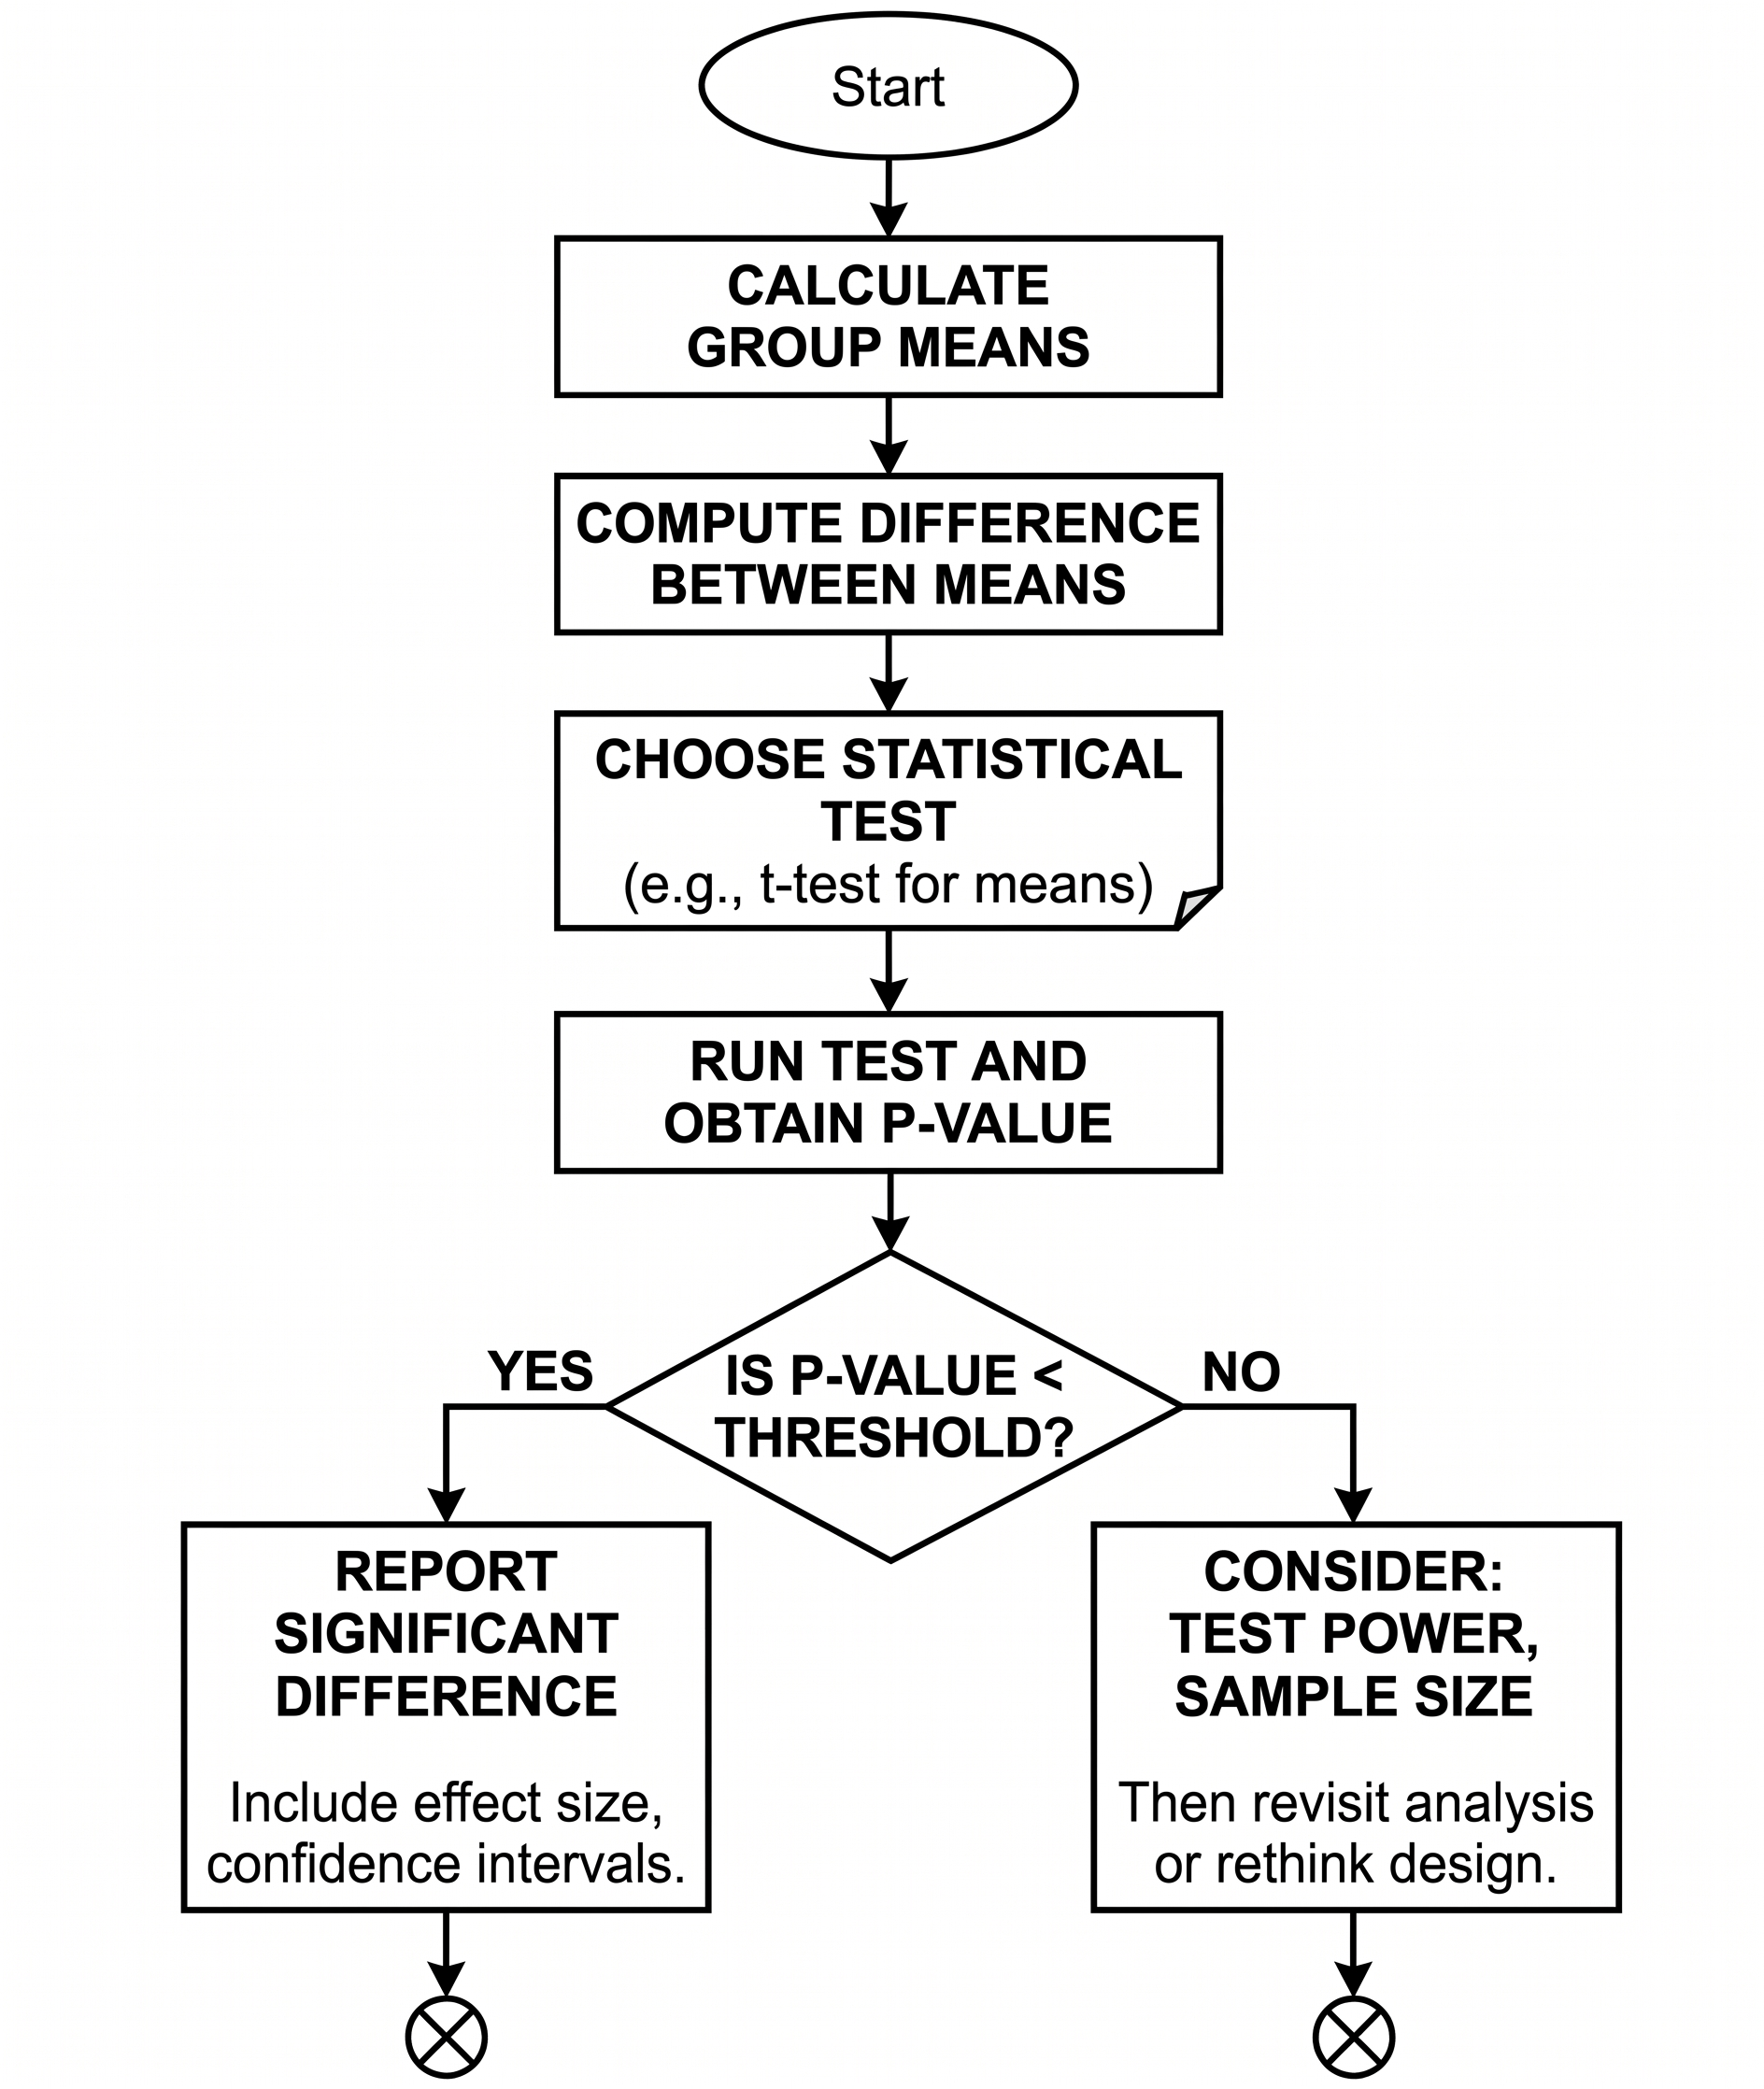
Analyzing A/B test results involves a clear set of steps to ensure your conclusions are both statistically sound and practically useful. You start by summarizing the data for each group, then compare the groups using statistical tests. Here is a simple flowchart to guide your analysis process:
- Calculate group means;
- Compute the difference between group means;
- Select and perform an appropriate statistical test;
- Interpret the p-value and effect size;
- Consider both statistical and practical significance before making decisions.
Step-by-step analysis:
- Calculate group means: Find the average outcome (such as conversion rate or revenue per user) for both the A and B groups.
- Compute the difference: Subtract the mean of group A from the mean of group B to see the observed effect.
- Perform a statistical test: Use a t-test (for comparing means) or another suitable test based on your metric and data distribution. This helps determine if the observed difference is likely due to chance.
- Interpret results: Review the p-value from the test to judge statistical significance, and also look at the size of the effect to understand its practical importance.
Flowchart for A/B Test Analysis:
12345678910111213141516171819202122232425262728import numpy as np from scipy import stats # Simulate A/B test data: conversion rates for groups A and B np.random.seed(42) group_a = np.random.binomial(1, 0.12, size=500) # 12% conversion group_b = np.random.binomial(1, 0.15, size=500) # 15% conversion # Calculate group means (conversion rates) mean_a = np.mean(group_a) mean_b = np.mean(group_b) diff = mean_b - mean_a print(f"Group A mean (conversion rate): {mean_a:.3f}") print(f"Group B mean (conversion rate): {mean_b:.3f}") print(f"Difference in means (B - A): {diff:.3f}") # Perform an independent two-sample t-test t_stat, p_value = stats.ttest_ind(group_b, group_a) print(f"t-statistic: {t_stat:.3f}") print(f"p-value: {p_value:.4f}") # Interpretation: if p_value < 0.05: print("Result: Statistically significant difference detected.") else: print("Result: No statistically significant difference detected.")
When interpreting your A/B test results, remember that statistical significance does not always mean the change is important for your business. A result can be statistically significant (low p-value) but have a very small effect size that may not justify making a change. Always check both the size of the effect and its relevance to your goals. Practical significance considers whether the difference is large enough to matter in your context, such as increasing revenue or improving user experience. Context is crucial: consider factors like implementation cost, user impact, and business priorities before acting on test results.
Thanks for your feedback!
Ask AI

Ask AI

Ask anything or try one of the suggested questions to begin our chat
