Capstone: Stress-Test Your Portfolio
Swipe to show menu
Over the previous 24 chapters you have moved from first principles to a complete analytical framework for thinking about investment risk and return. The capstone chapter pulls every tool together into a single stress-testing process – the same process professional portfolio managers run before making allocation decisions.
A portfolio stress test is not a prediction. It is a structured attempt to answer one question: does this portfolio survive the scenarios most likely to hurt it?
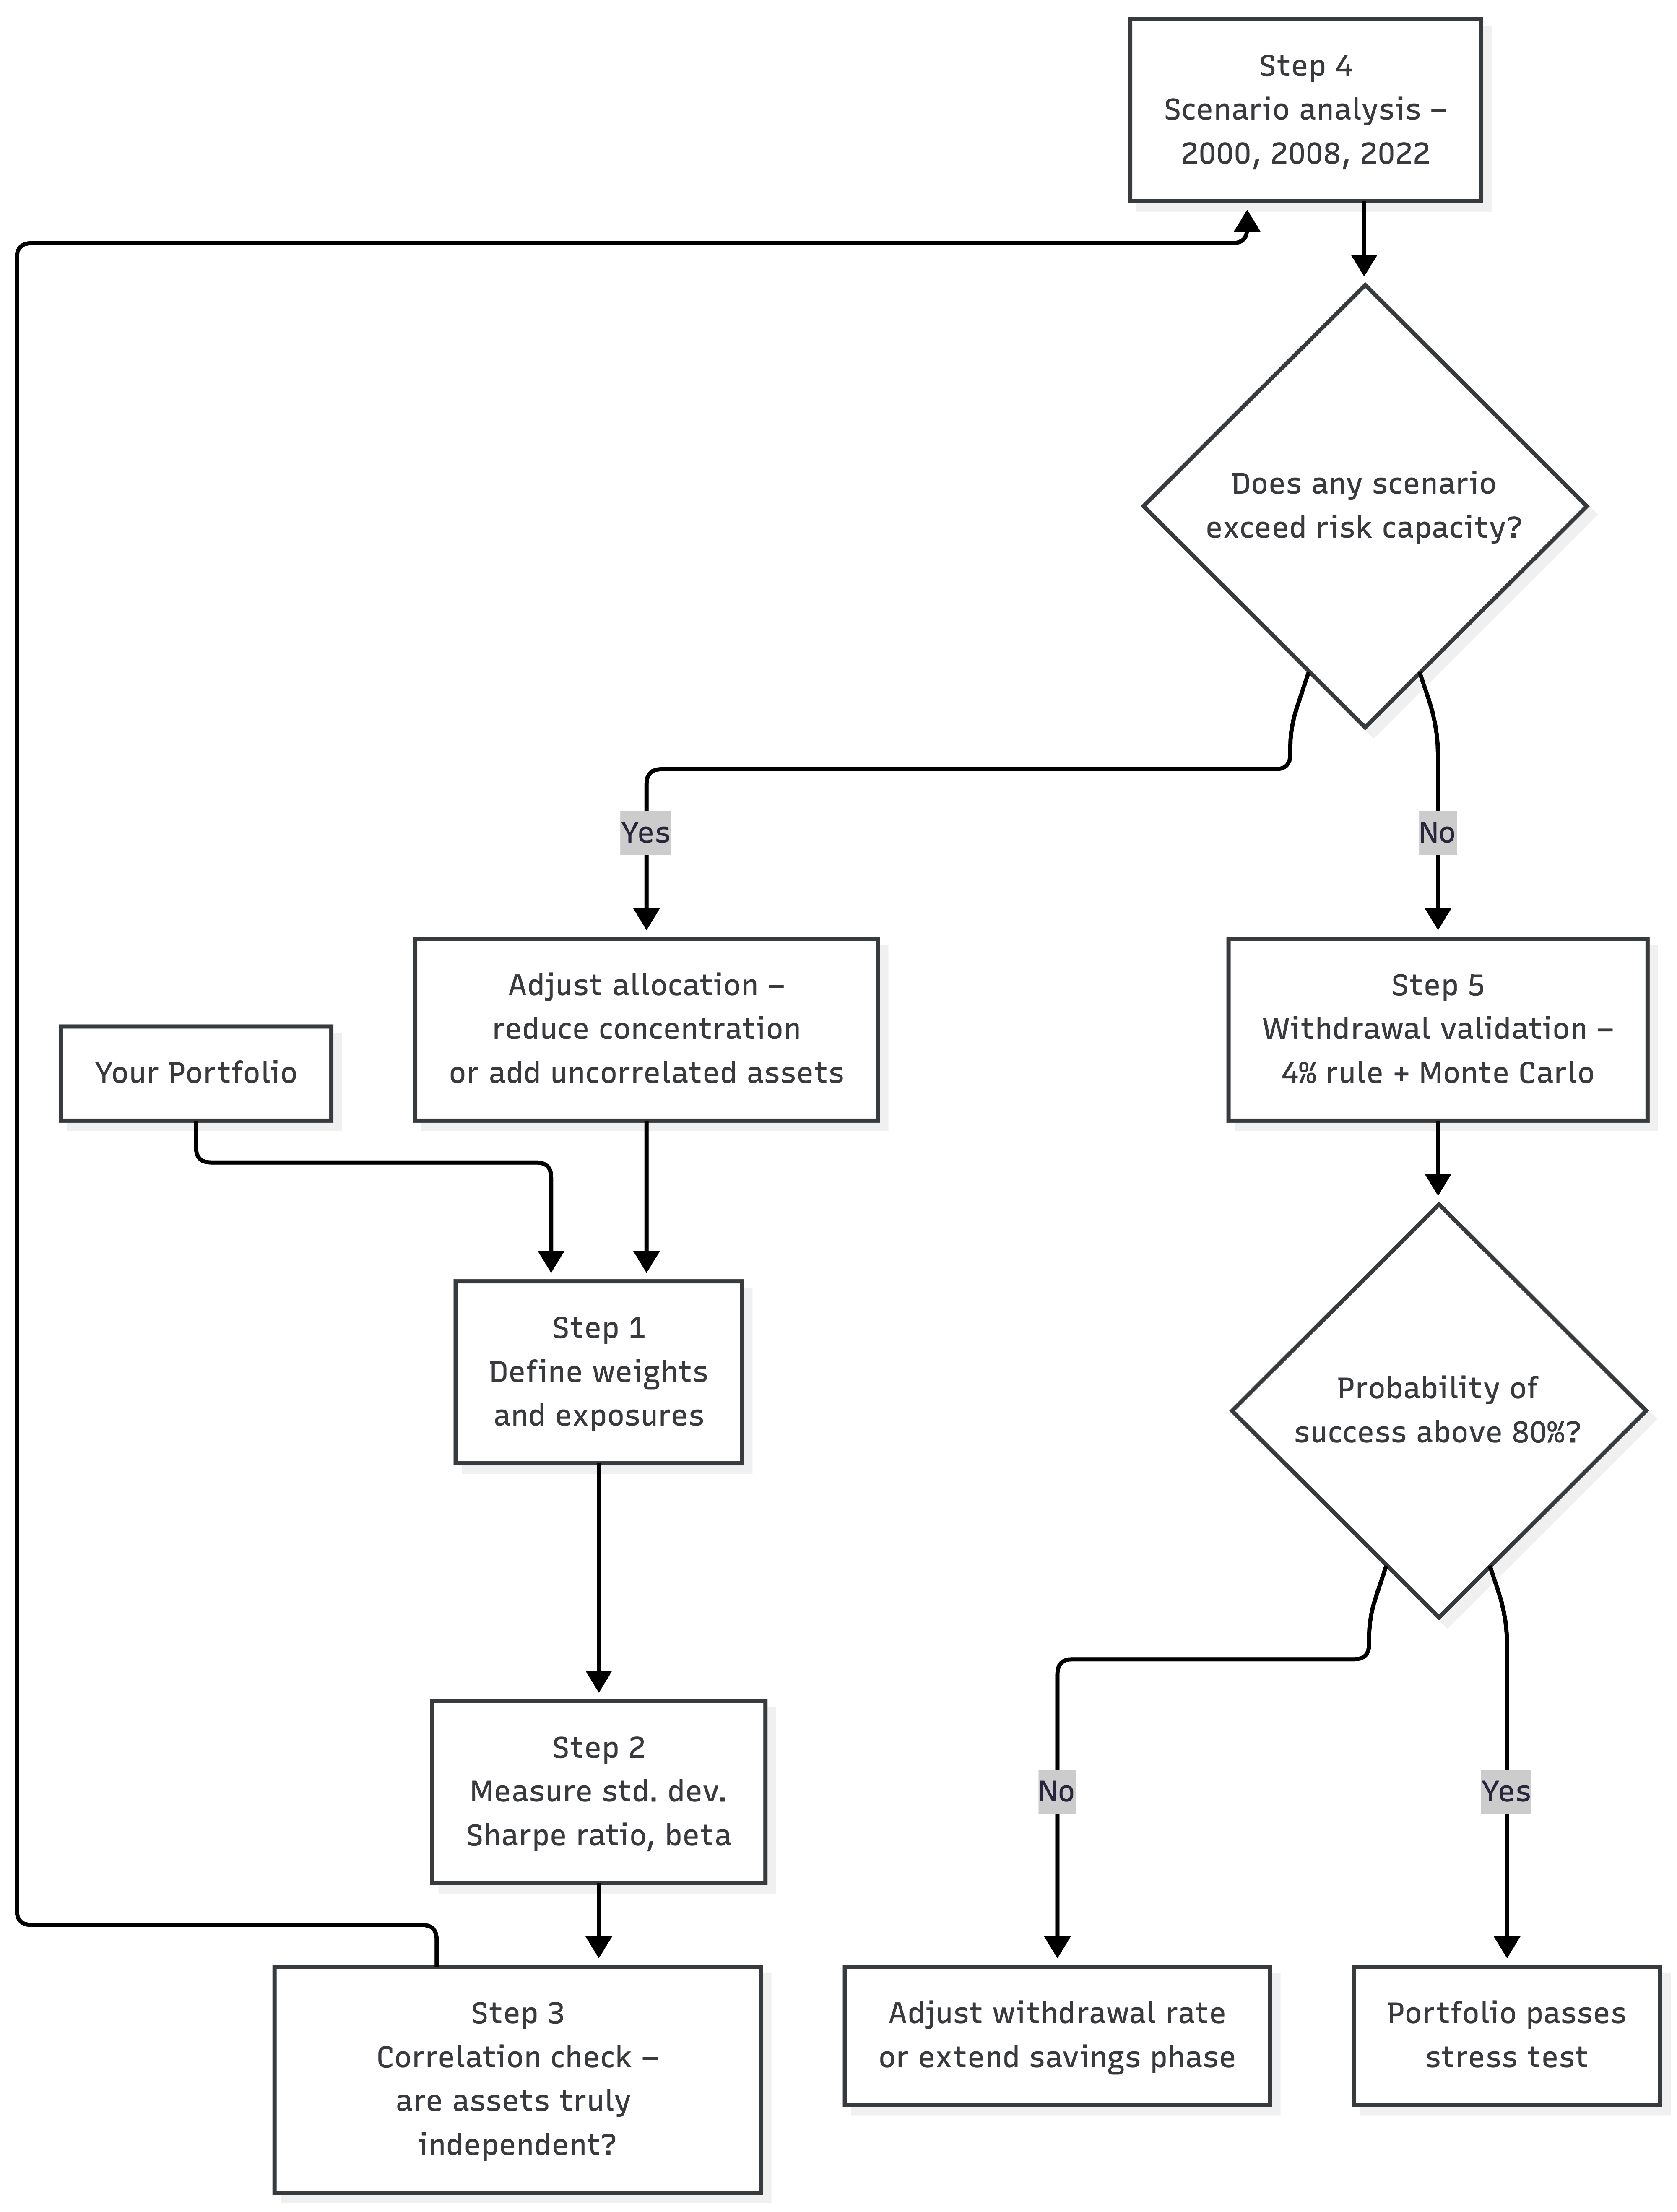
The process has five steps:
Step 1 and 2 – Define and Measure
Start with what you own. A portfolio isn't a list of tickers – it's a set of exposures. Two investors can hold completely different funds and have nearly identical risk profiles. Two investors can hold the same fund and have completely different portfolio risk if the weights differ.
For each position, identify:
- Weight – what percentage of the total portfolio;
- Expected return – historical average or forward estimate;
- Standard deviation – historical volatility;
- Beta – sensitivity to the broad market;
- Sharpe ratio – return per unit of risk.
Then calculate portfolio-level metrics using the variance formula from Chapter 9. The portfolio standard deviation will be lower than the weighted average of individual standard deviations – if it isn't, your assets are more correlated than you think.
Steps 3 and 4 – Diversification and Scenarios
Correlation check: build a simple matrix of pairwise correlations between your major holdings. Any correlation above +0.85 between two positions is a warning – you are paying for diversification you aren't getting.
Scenario analysis: apply three historical stress scenarios to your current allocation and estimate the impact:
Apply each scenario to your weights and calculate the estimated portfolio drawdown. If any scenario produces a loss that exceeds your risk capacity – the amount you can afford to lose without derailing your goals – the portfolio needs adjustment.
Step 5 – Validate the Withdrawal Plan
If you are in or approaching the withdrawal phase, add two final checks:
4% rule check: divide your target annual spending by 0.04. Is your current portfolio at or above that number? If not, what withdrawal rate does your portfolio actually support?
Monte Carlo check: run your portfolio through a Monte Carlo simulation with your actual withdrawal rate, time horizon, and inflation assumption. What is the probability of success? If it's below 80%, the plan needs adjustment – either lower withdrawals, higher savings, or a more growth-oriented allocation earlier in retirement.
Glide path check: is your current equity allocation consistent with your age and time horizon? Are you on track, too aggressive, or too conservative relative to your risk capacity?

A stress test doesn't need to be run by a financial advisor or require specialized software. A spreadsheet with your allocations, historical return data, and the formulas from this course covers the essential calculations. The goal is not mathematical precision – it is structured thinking about what could go wrong and whether your portfolio is positioned to survive it.

Vanguard's Portfolio Analytics tool, Portfolio Visualizer (portfoliovisualizer.com), and FIRECalc are free tools that run historical backtests and Monte Carlo simulations on custom portfolios. They implement the same concepts covered in this course and allow you to stress-test real allocations against historical sequences without building a model from scratch.
1. An investor runs a correlation check and finds that two of their largest holdings have a pairwise correlation of +0.91. What is the most appropriate action?
2. An investor's Monte Carlo simulation shows a 71% probability of success over a 30-year retirement at their current withdrawal rate. They are 63 years old with no pension. What combination of adjustments is most likely to improve this outcome?
Thanks for your feedback!
Ask AI

Ask AI

Ask anything or try one of the suggested questions to begin our chat
