Monte Carlo Simulation
Swipe to show menu
Most retirement calculators show you one line: your portfolio grows at 7% per year, you withdraw steadily, and the balance either lasts or it doesn't. That single line is a useful approximation – and a deeply misleading one.
Real markets don't return 7% every year. They return +28% one year, −18% the next, +14% after that. The sequence, the volatility, and the randomness all matter. A single projected line hides all of that.
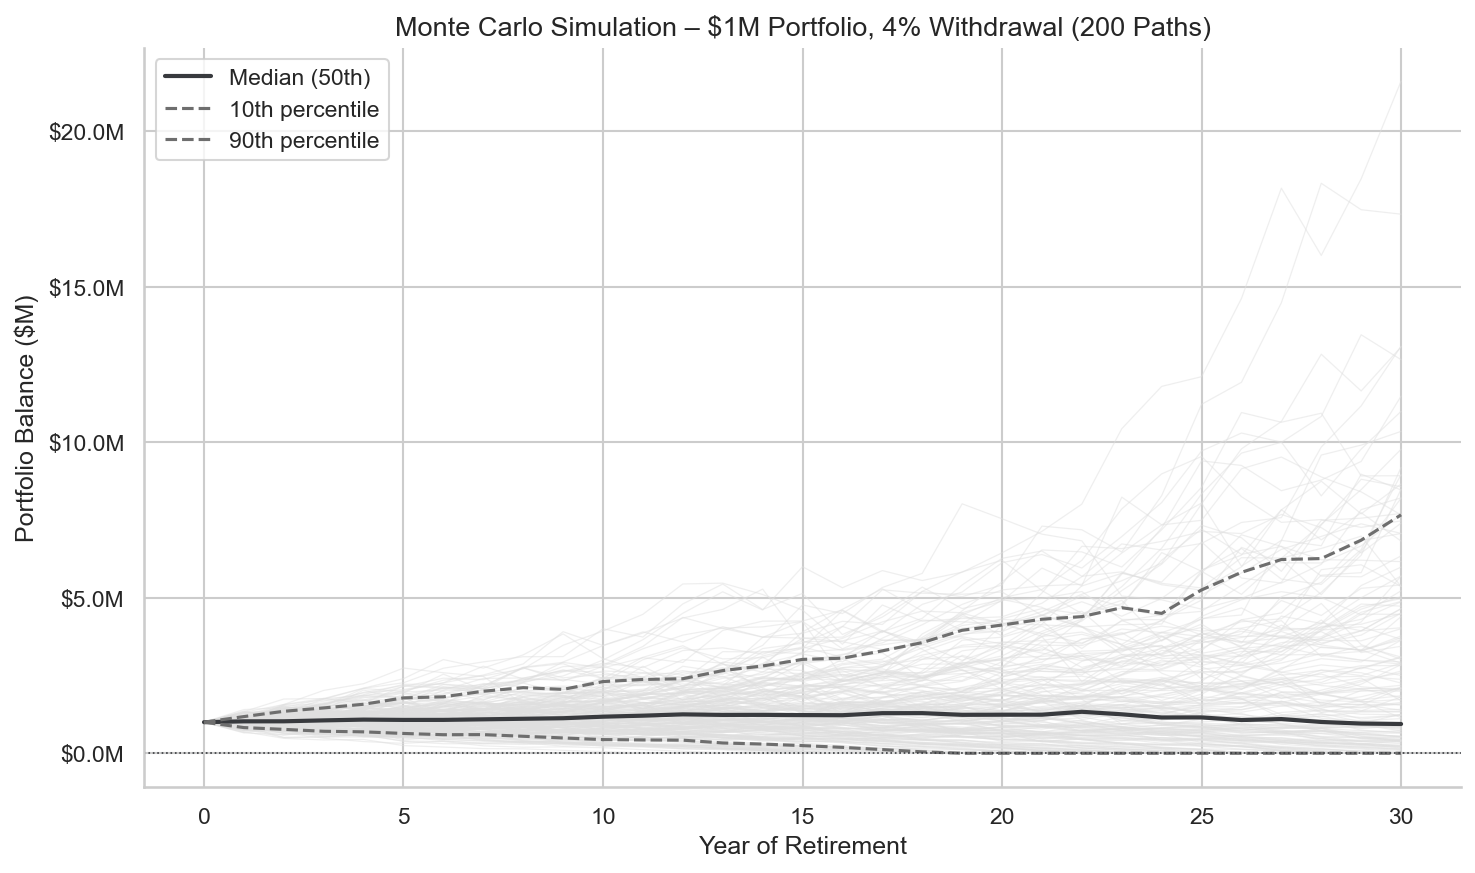
Monte Carlo simulation solves this by running thousands of scenarios simultaneously – each with a different randomized sequence of returns drawn from historical distributions. Instead of one outcome, you get a range:
"Probability of success" means the portfolio doesn't reach zero before the end of the horizon. An 85% success rate means that in 850 out of 1,000 simulated retirements, the money lasted.
What the Simulation Actually Does
Each Monte Carlo run samples returns randomly from a distribution based on historical data – mean return, standard deviation, and correlation between asset classes. Run it 10,000 times and you get 10,000 different retirement paths.
The output isn't a prediction. It's a probability distribution of outcomes – showing not just the most likely result but the range of possibilities and how likely each is.
- The median line shows the middle outcome – half of simulations did better, half did worse;
- The 10th percentile line shows what a bad but not catastrophic sequence looks like;
- The 5th percentile line shows near-worst-case scenarios – useful for stress testing;
- The width of the cone reflects how much uncertainty compounds over time – wider cones mean more uncertainty, not worse expected outcomes.

A computational method that runs thousands of simulations using randomly sampled return sequences to produce a probability distribution of portfolio outcomes. Rather than projecting a single path, Monte Carlo simulation shows the range of possible results and the likelihood of each.

Monte Carlo simulation is only as good as its inputs. If the historical return distribution it samples from doesn't reflect future conditions – lower expected returns, higher inflation, different correlations – the probability estimates will be wrong. An 85% success rate from a Monte Carlo model is not the same as an 85% guarantee. It is a structured estimate based on historical analogy.

Monte Carlo methods were developed at Los Alamos National Laboratory in the 1940s by physicists Stanislaw Ulam and John von Neumann, originally to model neutron diffusion in nuclear reactions. The technique was adapted for financial planning in the 1990s and is now standard in retirement planning software including Vanguard's retirement tools, Fidelity's Planning & Guidance Center, and most fee-only financial planning platforms.
1. A Monte Carlo simulation of a retirement portfolio shows an 82% probability of success over 30 years. What does this mean in practical terms?
2. Two retirement plans show the following Monte Carlo results over 30 years: Plan A has a median final balance of $2.1M with a 10th percentile outcome of $180,000. Plan B has a median final balance of $1.4M with a 10th percentile outcome of $620,000. Which plan is more appropriate for a risk-averse retiree and why?
Thanks for your feedback!
Ask AI

Ask AI

Ask anything or try one of the suggested questions to begin our chat
Monte Carlo Simulation
Most retirement calculators show you one line: your portfolio grows at 7% per year, you withdraw steadily, and the balance either lasts or it doesn't. That single line is a useful approximation – and a deeply misleading one.
Real markets don't return 7% every year. They return +28% one year, −18% the next, +14% after that. The sequence, the volatility, and the randomness all matter. A single projected line hides all of that.
Monte Carlo simulation solves this by running thousands of scenarios simultaneously – each with a different randomized sequence of returns drawn from historical distributions. Instead of one outcome, you get a range:
"Probability of success" means the portfolio doesn't reach zero before the end of the horizon. An 85% success rate means that in 850 out of 1,000 simulated retirements, the money lasted.
What the Simulation Actually Does
Each Monte Carlo run samples returns randomly from a distribution based on historical data – mean return, standard deviation, and correlation between asset classes. Run it 10,000 times and you get 10,000 different retirement paths.
The output isn't a prediction. It's a probability distribution of outcomes – showing not just the most likely result but the range of possibilities and how likely each is.
- The median line shows the middle outcome – half of simulations did better, half did worse;
- The 10th percentile line shows what a bad but not catastrophic sequence looks like;
- The 5th percentile line shows near-worst-case scenarios – useful for stress testing;
- The width of the cone reflects how much uncertainty compounds over time – wider cones mean more uncertainty, not worse expected outcomes.
A computational method that runs thousands of simulations using randomly sampled return sequences to produce a probability distribution of portfolio outcomes. Rather than projecting a single path, Monte Carlo simulation shows the range of possible results and the likelihood of each.
Monte Carlo simulation is only as good as its inputs. If the historical return distribution it samples from doesn't reflect future conditions – lower expected returns, higher inflation, different correlations – the probability estimates will be wrong. An 85% success rate from a Monte Carlo model is not the same as an 85% guarantee. It is a structured estimate based on historical analogy.
Monte Carlo methods were developed at Los Alamos National Laboratory in the 1940s by physicists Stanislaw Ulam and John von Neumann, originally to model neutron diffusion in nuclear reactions. The technique was adapted for financial planning in the 1990s and is now standard in retirement planning software including Vanguard's retirement tools, Fidelity's Planning & Guidance Center, and most fee-only financial planning platforms.
Thanks for your feedback!
