Volatility as a Number
Swipe to show menu
When someone says a stock is "risky," they usually mean it moves a lot. But "a lot" isn't a number – standard deviation is.
Standard deviation measures how much an asset's returns spread around their average. A stock that returns +10% on average but swings between -20% and +40% has a high standard deviation. One that stays between +5% and +15% has a low one.
Higher potential return almost always comes with higher standard deviation. That's not a coincidence – it's the risk-return tradeoff in its most basic form.
How to Read It in Practice
Standard deviation is expressed in the same units as the returns themselves – percentage points. If a fund has an average return of 8% and a standard deviation of 10%, that means:
- In a typical year, returns fall somewhere between -2% and +18%;
- In a bad year, they could go further – standard deviation doesn't cap the extremes;
- Two funds with the same average return but different standard deviations are not the same investment.
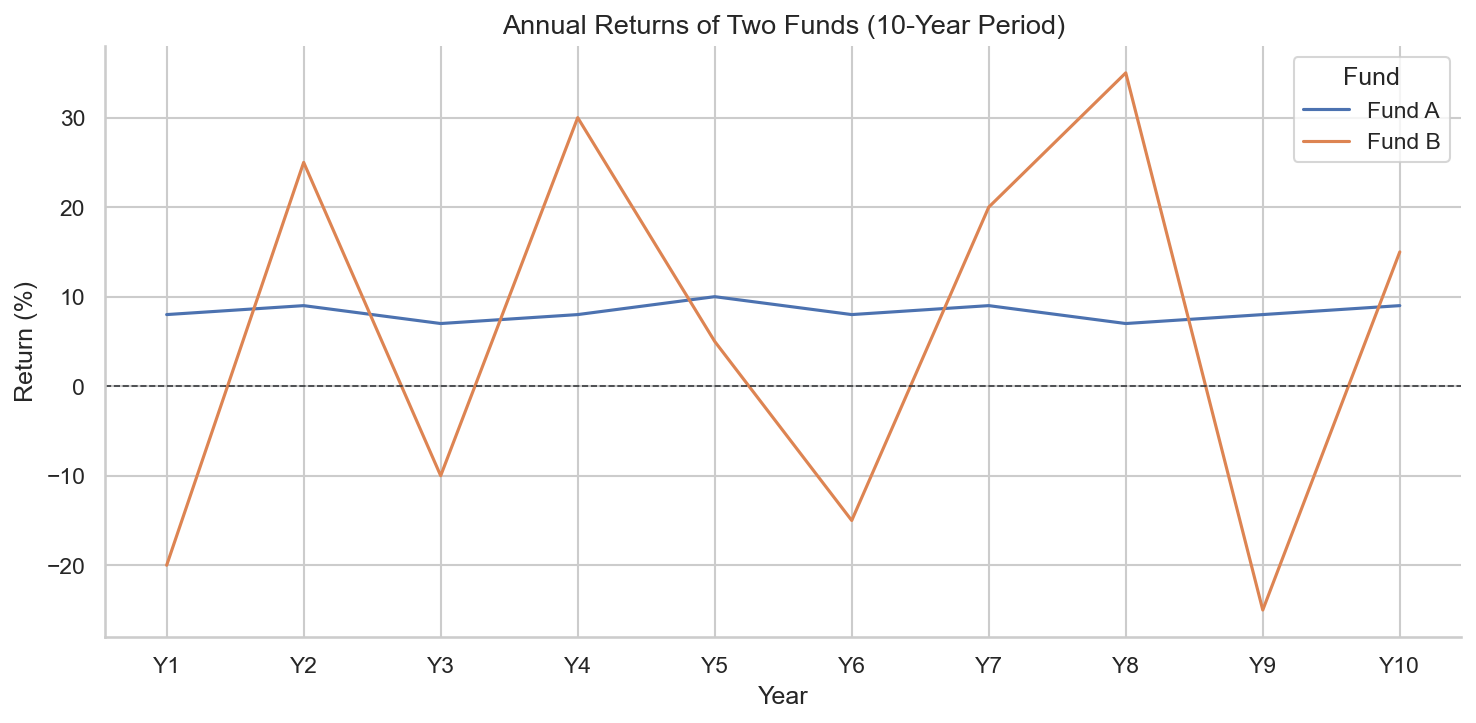
Fund A (flat line) vs Fund B (volatile line) – same 10-year average, very different standard deviation.

Standard Deviation is a statistical measure of how much an asset's returns vary around their average. A higher standard deviation means wider swings – more upside potential and more downside exposure.

Standard deviation is calculated from historical returns. It tells you how volatile an asset has been – not how volatile it will be. A stock with low historical volatility can still surprise you.
1. Two ETFs have an average annual return of 9%. ETF A has a standard deviation of 5%, ETF B has a standard deviation of 22%. Which statement is correct?
2. A bond fund reports an average return of 4% with a standard deviation of 2%. What does this tell you?
Thanks for your feedback!
Ask AI

Ask AI

Ask anything or try one of the suggested questions to begin our chat
