single
Why Matplotlib Matters?
Swipe to show menu
Matplotlib is a powerful and widely used Python library for creating static, animated, and interactive visualizations. It provides a flexible and customizable way to generate a wide range of plots and charts, including line plots, bar charts, histograms, scatter plots, and more.
Although it offers comprehensive functionality to create a variety of plot types, it remains surprisingly easy to use. On top of that, matplotlib is open source, which means it is freely available and continuously improved by a large community.
matplotlib is an excellent starting point for learning data visualization in Python, as many other libraries are built on top of it.
Before diving into matplotlib let's have a look at an example of the plot created with its help:
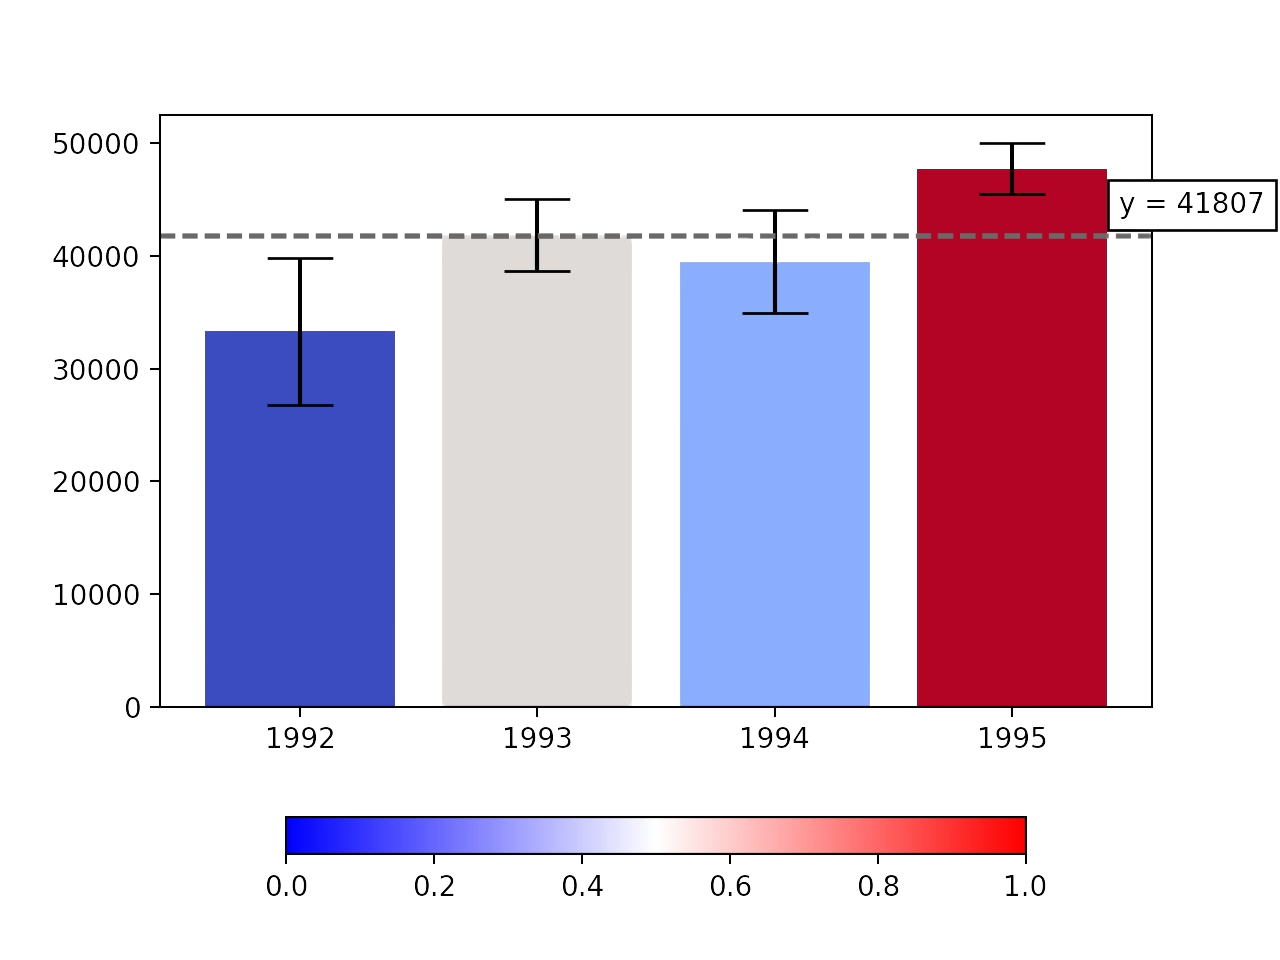
This plot can be created with only a few lines of code. Furthermore, it is possible to make it interactive, showcasing the capabilities of matplotlib.
The majority of matplotlib utilities are located in the pyplot submodule, which is used throughout the course.
Swipe to start coding
There are two possible ways to import it, the first one is more common, while the second one is more appropriate according to PEP.
- Import the
pyplotsubmodule from thematplotliblibrary with thepltalias without using thefromkeyword. - Import the
pyplotsubmodule from thematplotliblibrary with thepltalias using thefromkeyword.
Solution
Thanks for your feedback!
single
Ask AI
Ask AI

Ask anything or try one of the suggested questions to begin our chat
