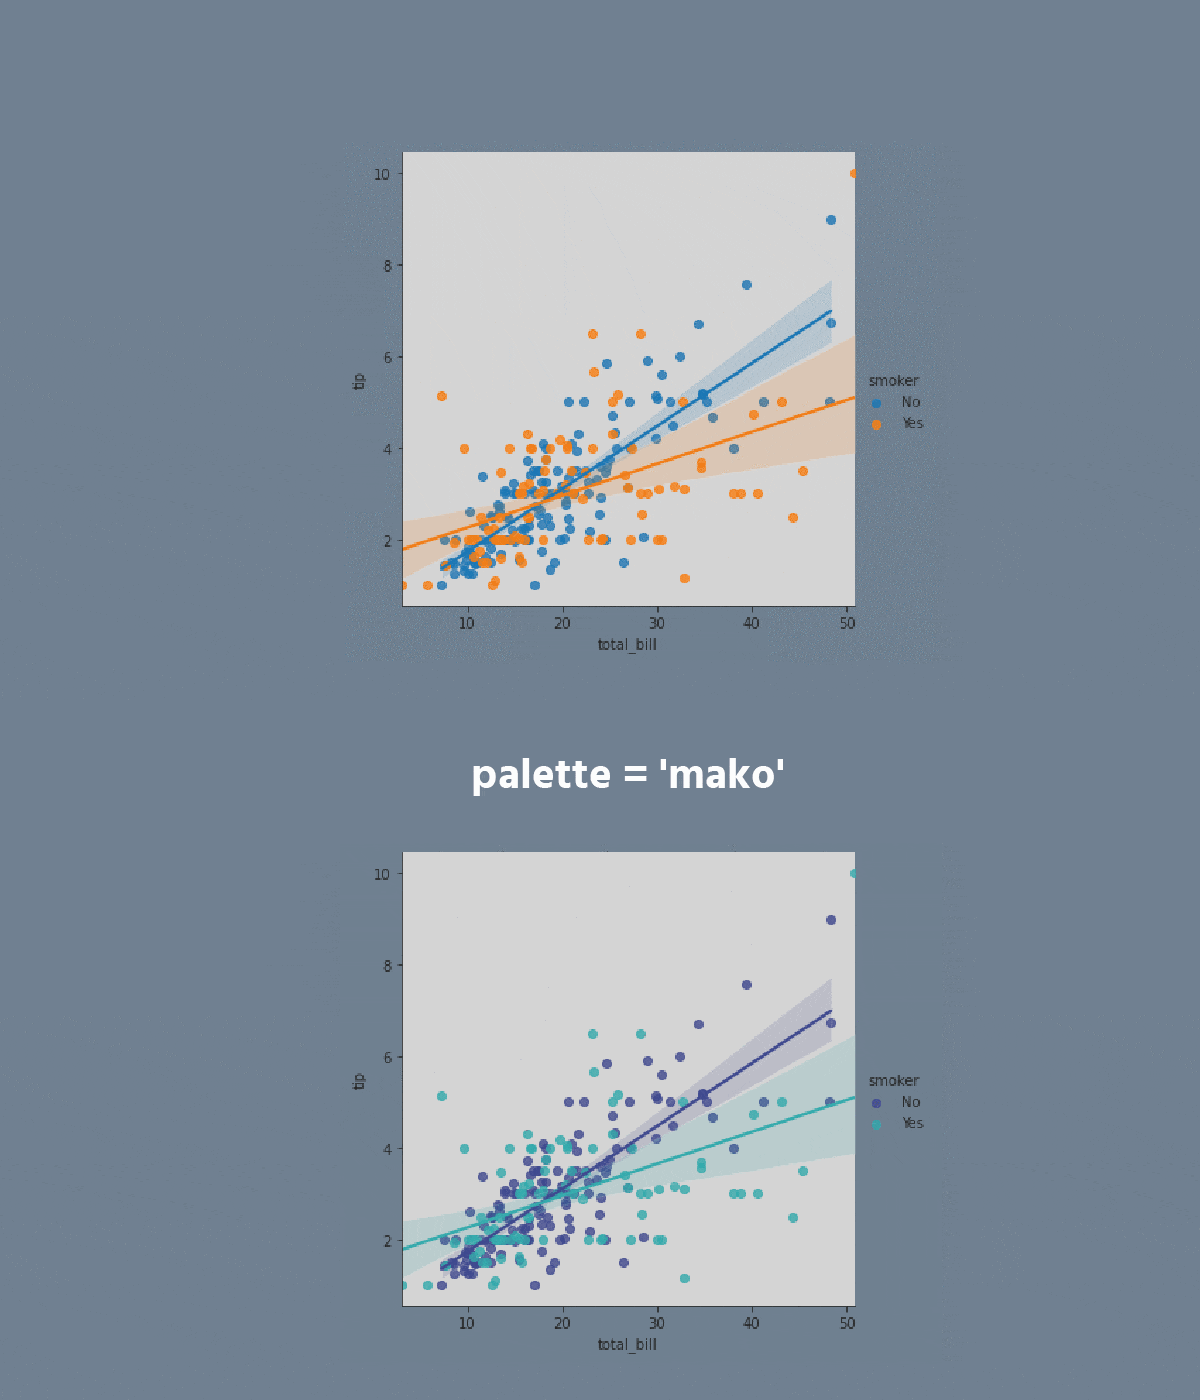
 Lmplot
Note
lmplot=FacetGrid+regplot


Task
Swipe to start coding
- Set the
'darkgrid'style with the'lightpink'figure.facecolor. - Create a
lmplotusing theseabornlibrary:
- Set the
xparameter equals the'total_bill'; - Set the
yparameter equals the'tip'; - Set the
hueparameter equals'smoker'; - Set the
colparameter equals the'sex'; - Set the
'o'and'x'markers; - Set the
'crest'palette; - Set the data;
- Display the plot.
Solution
Everything was clear?
Thanks for your feedback!
Section 6. Chapter 2
single
Ask AI
Ask AI

Ask anything or try one of the suggested questions to begin our chat

Awesome!
Completion rate improved to 4.35 Lmplot
Swipe to show menu
Note
lmplot=FacetGrid+regplot


Task
Swipe to start coding
- Set the
'darkgrid'style with the'lightpink'figure.facecolor. - Create a
lmplotusing theseabornlibrary:
- Set the
xparameter equals the'total_bill'; - Set the
yparameter equals the'tip'; - Set the
hueparameter equals'smoker'; - Set the
colparameter equals the'sex'; - Set the
'o'and'x'markers; - Set the
'crest'palette; - Set the data;
- Display the plot.
Solution
Everything was clear?
Thanks for your feedback!
Section 6. Chapter 2
single