Star Schema Patterns for Excel Users
Swipe to show menu
Star Schema
One central fact table connected directly to dimension tables. Clear, predictable filter flow. Works reliably with DAX and Power Pivot.
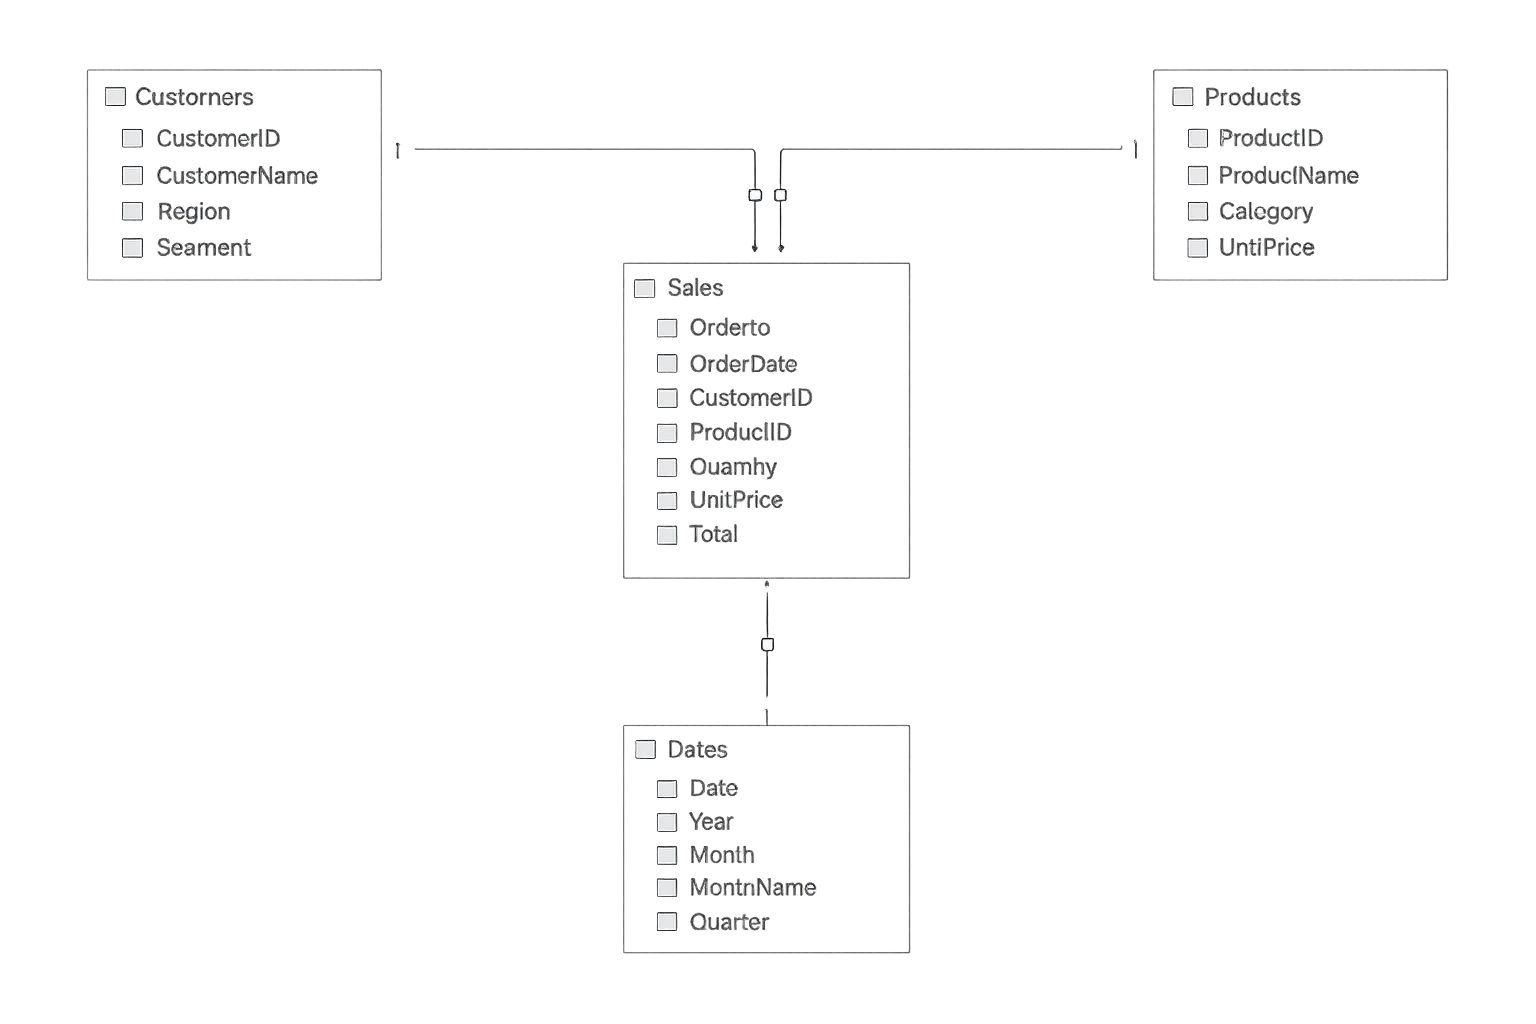

The star schema is not Excel-specific. If you work with a data engineer, a BI developer, or a SQL analyst, this is the structure they will be most familiar with. Building it in Excel puts your model on the same conceptual footing as professional data tools.
Snowflake Schema
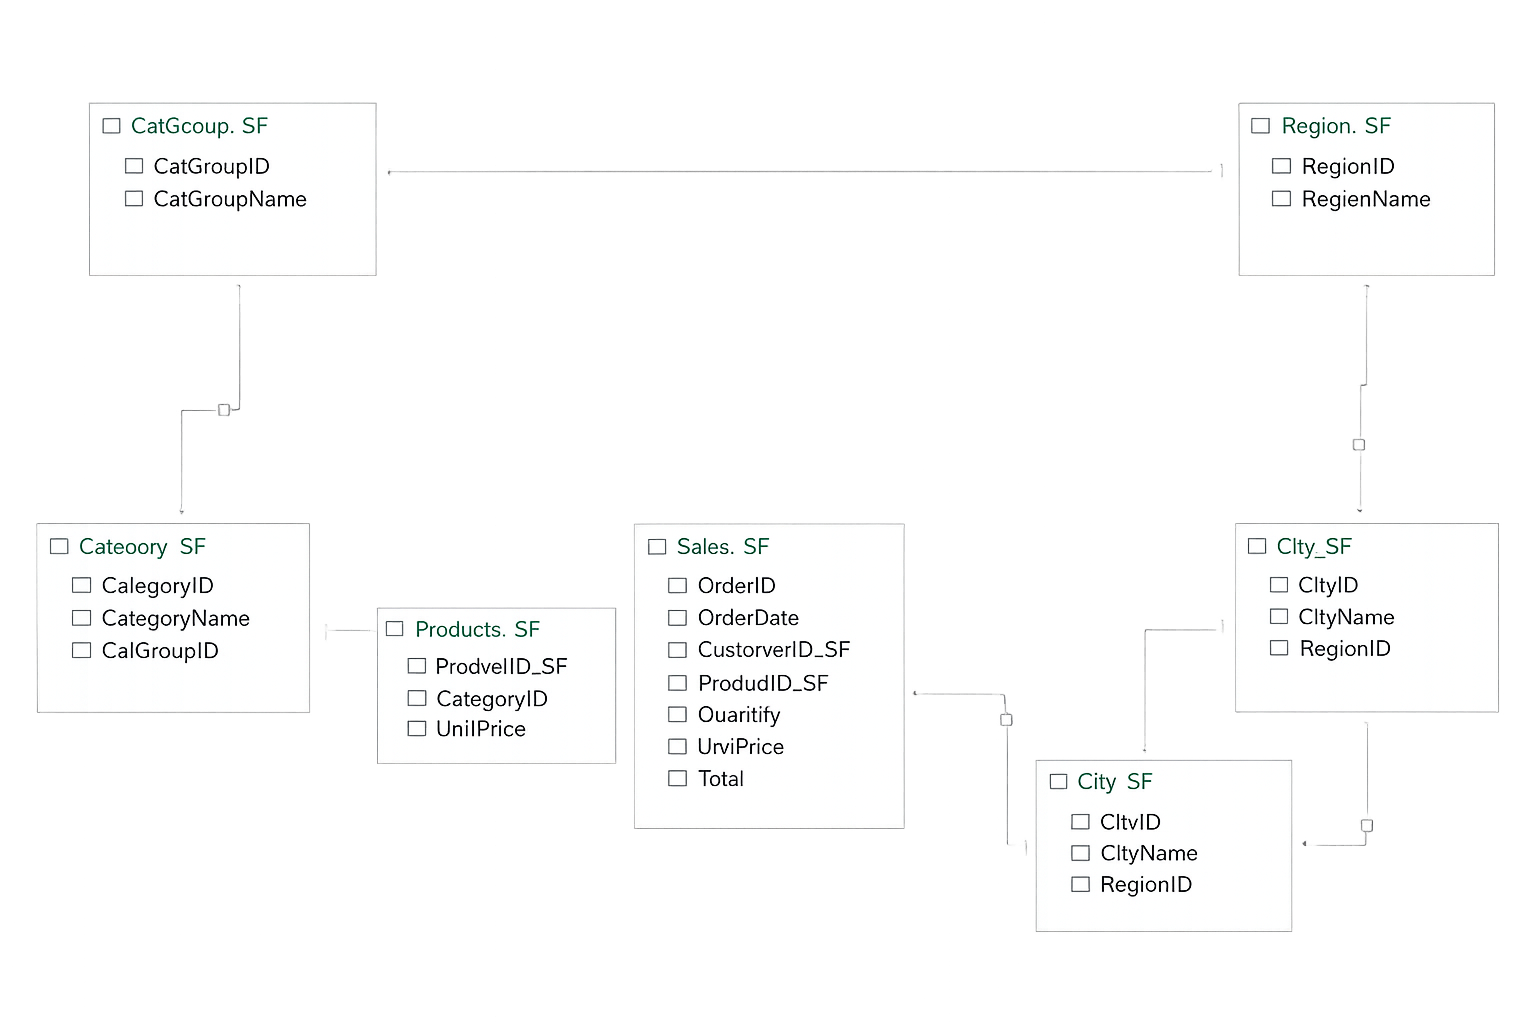
Dimension tables broken into sub-tables forming chains. More normalized but DAX measures do not work reliably in Power Pivot.
A snowflake schema starts with a star schema and then breaks dimension tables down further into sub-tables. For example, instead of a single Customers table containing city and region, the city data lives in a Cities table and region data in a Regions table — forming a chain: Customers → Cities → Regions.
Spaghetti Model
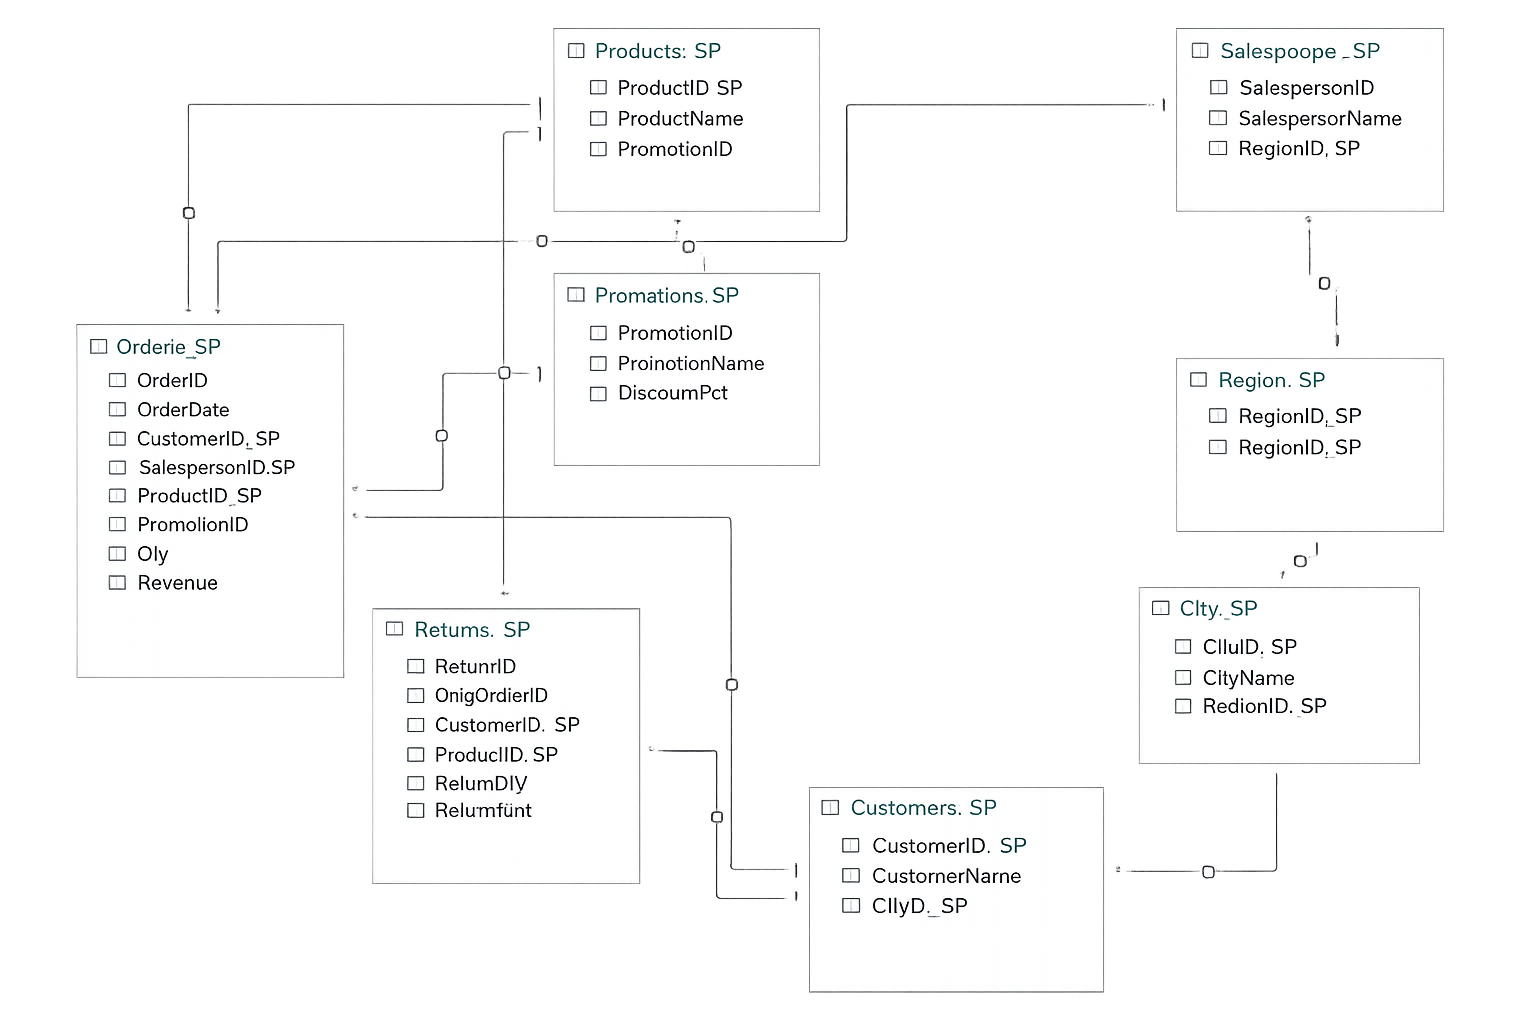
No clear structure. Tables connected in multiple directions. Filters take ambiguous paths and produce wrong numbers silently.
Tables are connected in multiple directions — dimension tables link to each other, fact tables connect through shared dimension tables, and the diagram view resembles tangled lines rather than a recognisable shape.
Silent wrong numbers are the most dangerous outcome in any model. A visible error prompts investigation. A plausible-looking wrong number may go unnoticed and lead to bad business decisions.
Thanks for your feedback!
Ask AI

Ask AI

Ask anything or try one of the suggested questions to begin our chat
Star Schema Patterns for Excel Users
Star Schema
One central fact table connected directly to dimension tables. Clear, predictable filter flow. Works reliably with DAX and Power Pivot.
The star schema is not Excel-specific. If you work with a data engineer, a BI developer, or a SQL analyst, this is the structure they will be most familiar with. Building it in Excel puts your model on the same conceptual footing as professional data tools.
Snowflake Schema
Dimension tables broken into sub-tables forming chains. More normalized but DAX measures do not work reliably in Power Pivot.
A snowflake schema starts with a star schema and then breaks dimension tables down further into sub-tables. For example, instead of a single Customers table containing city and region, the city data lives in a Cities table and region data in a Regions table — forming a chain: Customers → Cities → Regions.
Spaghetti Model
No clear structure. Tables connected in multiple directions. Filters take ambiguous paths and produce wrong numbers silently.
Tables are connected in multiple directions — dimension tables link to each other, fact tables connect through shared dimension tables, and the diagram view resembles tangled lines rather than a recognisable shape.
Silent wrong numbers are the most dangerous outcome in any model. A visible error prompts investigation. A plausible-looking wrong number may go unnoticed and lead to bad business decisions.
Thanks for your feedback!
