Aplicaciones de Gráficos
Desliza para mostrar el menú
En el mundo acelerado de hoy, la cantidad de datos sigue creciendo. La visualización ayuda a transformar datos en bruto en representaciones visuales informativas, facilitando la comprensión de la información relevante.
Las principales aplicaciones de la visualización son las siguientes:
- Comunicación: la visualización facilita transmitir ideas e información complejas a una amplia variedad de audiencias;
- Análisis: útil para proporcionar una visión clara de la distribución de los datos, relaciones y correlaciones;
- Toma de decisiones: fundamental en la creación de informes y paneles que apoyan la toma de decisiones estratégicas.
Suponga que dirige un negocio y desea observar las ventas de sus productos de enero a junio. Aquí tiene una gráfica que le permitirá verlo con claridad:
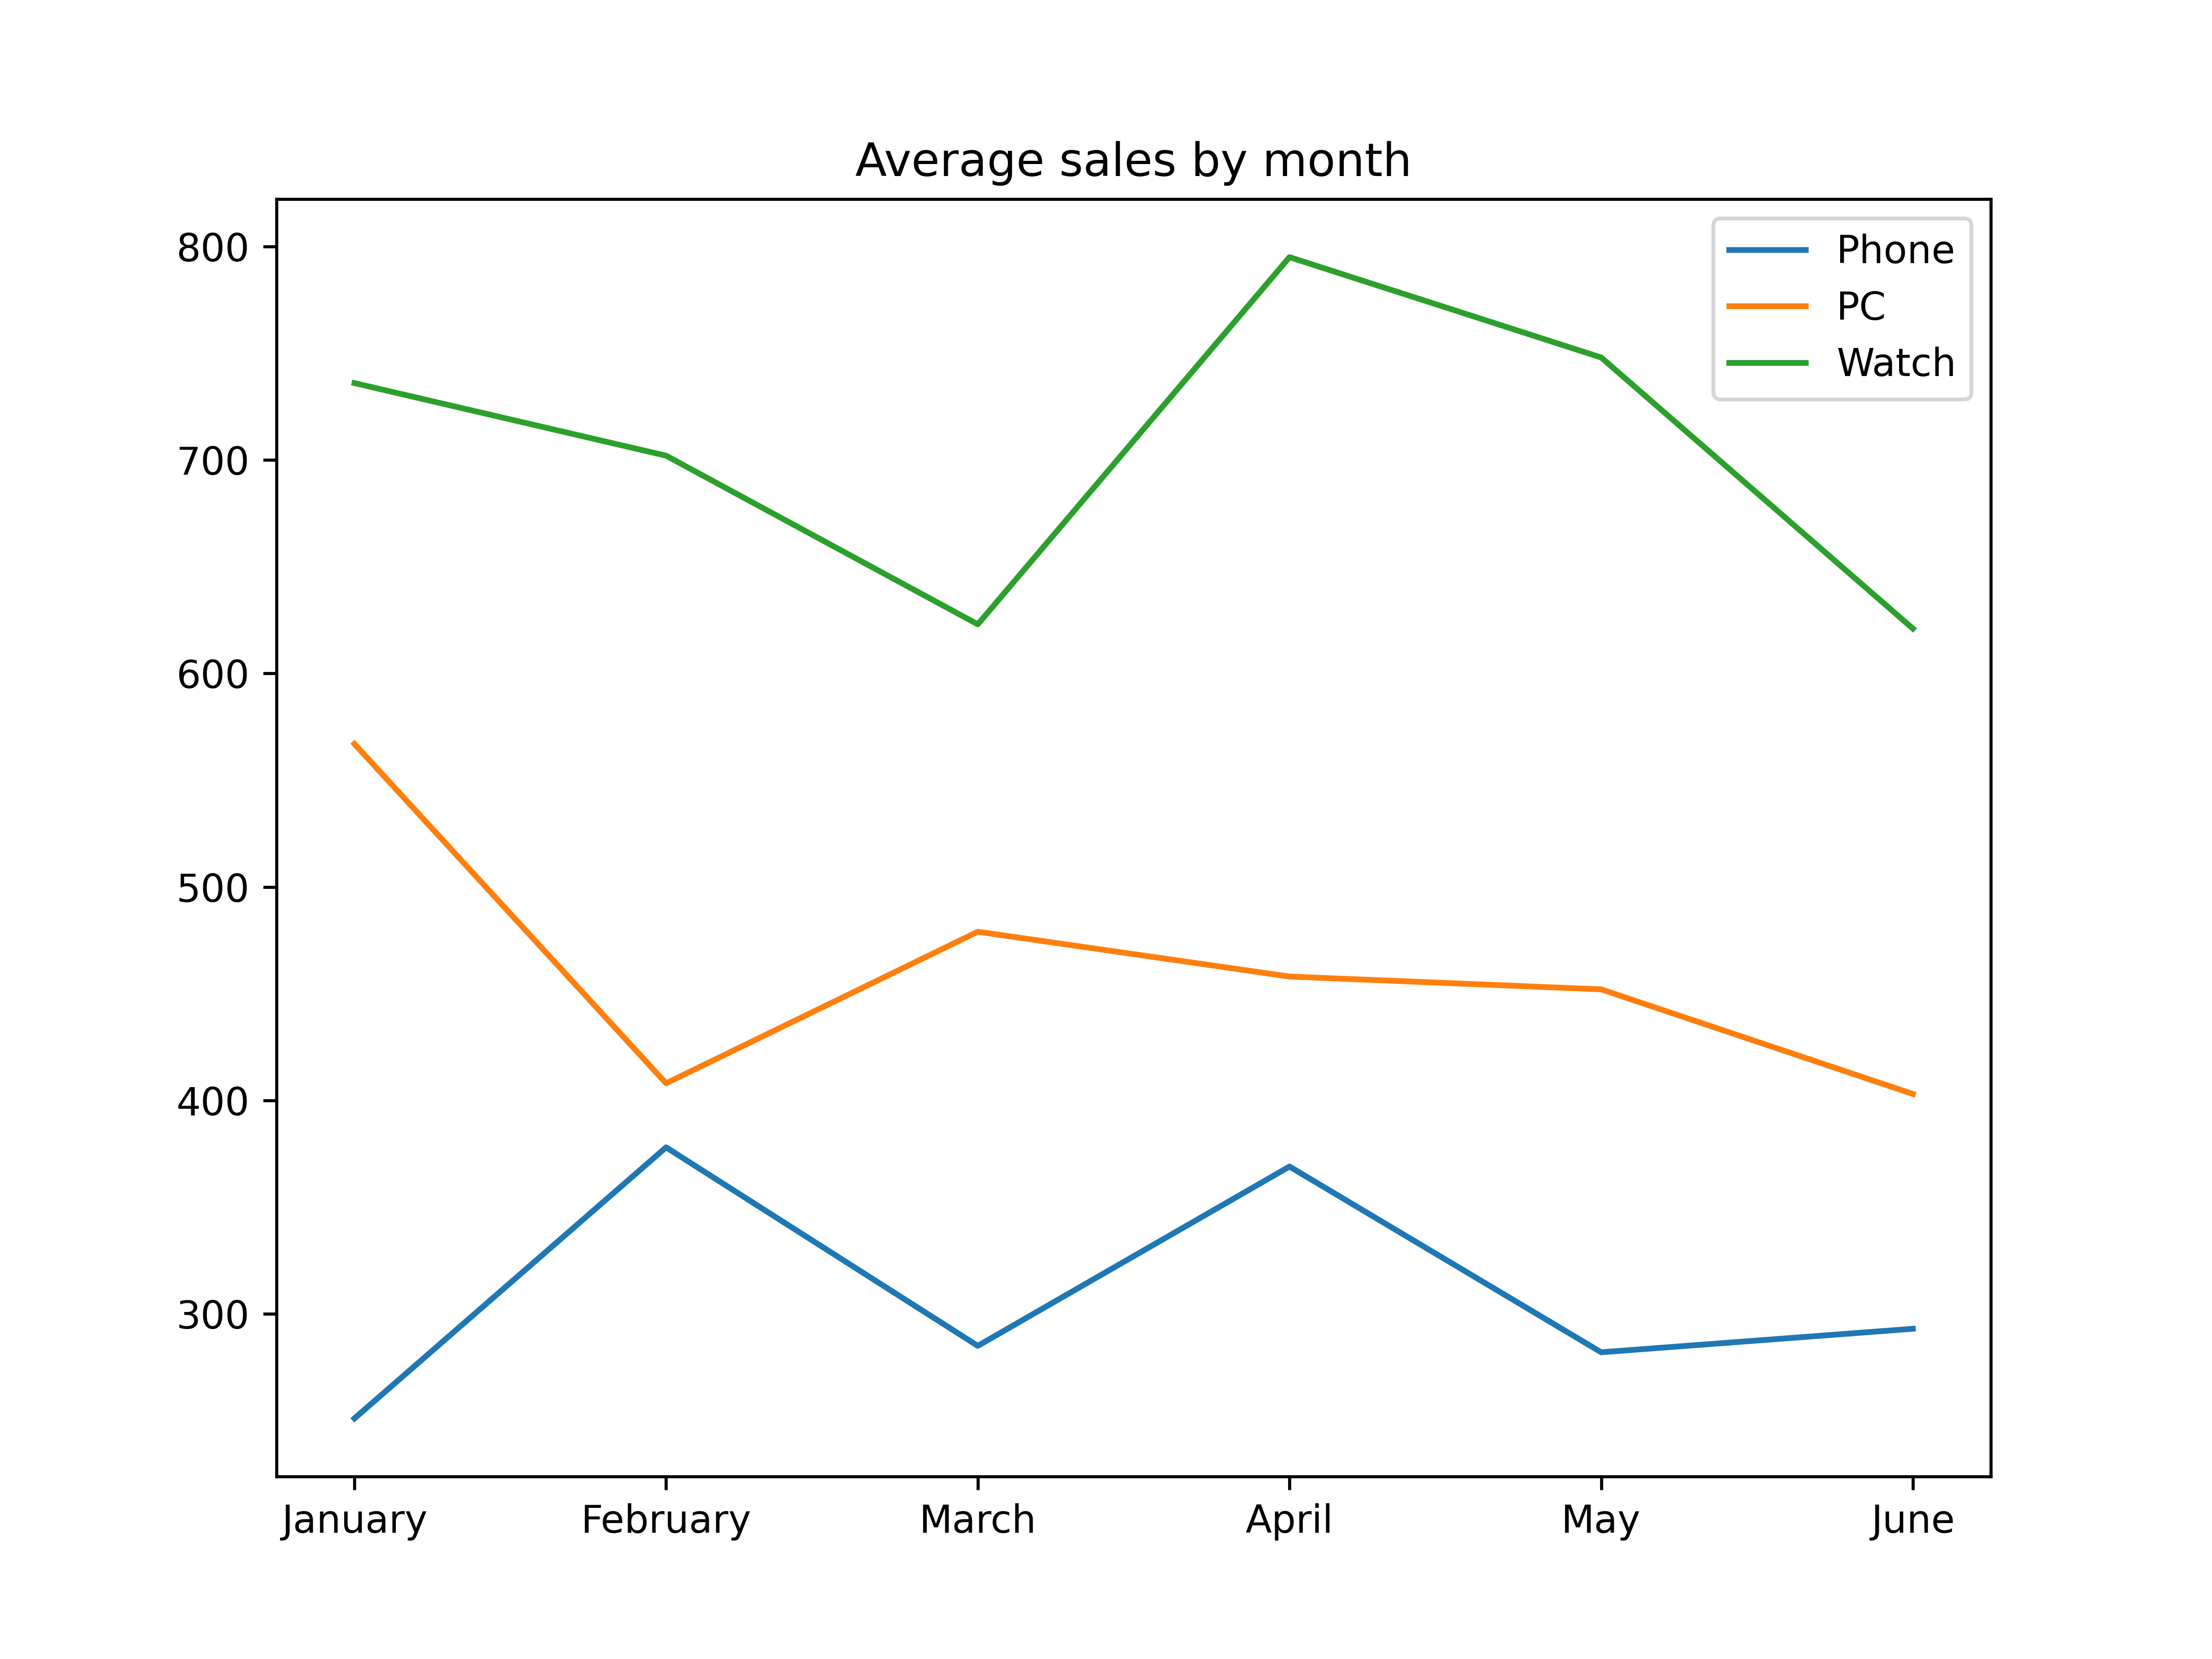
Este es un ejemplo con datos artificiales, pero muestra el número de ventas por mes y resalta las tendencias para cada producto.
Por ejemplo, las ventas de relojes han disminuido claramente en marzo y junio, lo que significa que estos meses en particular deben analizarse para explicar esta caída significativa en las ventas de relojes.
¡Gracias por tus comentarios!
Pregunte a AI
Pregunte a AI

Pregunte lo que quiera o pruebe una de las preguntas sugeridas para comenzar nuestra charla
Aplicaciones de Gráficos
En el mundo acelerado de hoy, la cantidad de datos sigue creciendo. La visualización ayuda a transformar datos en bruto en representaciones visuales informativas, facilitando la comprensión de la información relevante.
Las principales aplicaciones de la visualización son las siguientes:
- Comunicación: la visualización facilita transmitir ideas e información complejas a una amplia variedad de audiencias;
- Análisis: útil para proporcionar una visión clara de la distribución de los datos, relaciones y correlaciones;
- Toma de decisiones: fundamental en la creación de informes y paneles que apoyan la toma de decisiones estratégicas.
Suponga que dirige un negocio y desea observar las ventas de sus productos de enero a junio. Aquí tiene una gráfica que le permitirá verlo con claridad:
Este es un ejemplo con datos artificiales, pero muestra el número de ventas por mes y resalta las tendencias para cada producto.
Por ejemplo, las ventas de relojes han disminuido claramente en marzo y junio, lo que significa que estos meses en particular deben analizarse para explicar esta caída significativa en las ventas de relojes.
¡Gracias por tus comentarios!
