Gerelateerde cursussen
Bekijk Alle CursussenBeginner
Creating Custom AI Agents with Anthropic Claude
Learn how to create a fully functional MCP (Model Context Protocol) server to integrate AI models like Claude with real-world tools like Excel. Everything from core concepts to setting up your development environment and building your first working server that can analyze real data through natural language prompts. No advanced programming knowledge required, just curiosity and willingness to explore AI automation.

Beginner
Observability Fundamentals in DevOps
A beginner-friendly course introducing the essential concepts and practical applications of observability in DevOps. Learn how logs, metrics, and traces provide visibility into systems, how to use dashboards and alerts, and how to interpret service health using SLIs and SLOs. Each chapter combines clear explanations with real-world text-based examples to build foundational skills for modern DevOps workflows.

Beginner
Effective Logging Strategies
Master the art and science of logging for robust, maintainable, and observable software systems. This course guides software engineers and DevOps professionals through the principles, patterns, and practical tools needed to design and implement effective logging strategies in modern environments.
AI Agent Observability
Beyond Traditional APM

by Daniil Lypenets
Full Stack Developer
May, 2026・
14 min read


Introduction
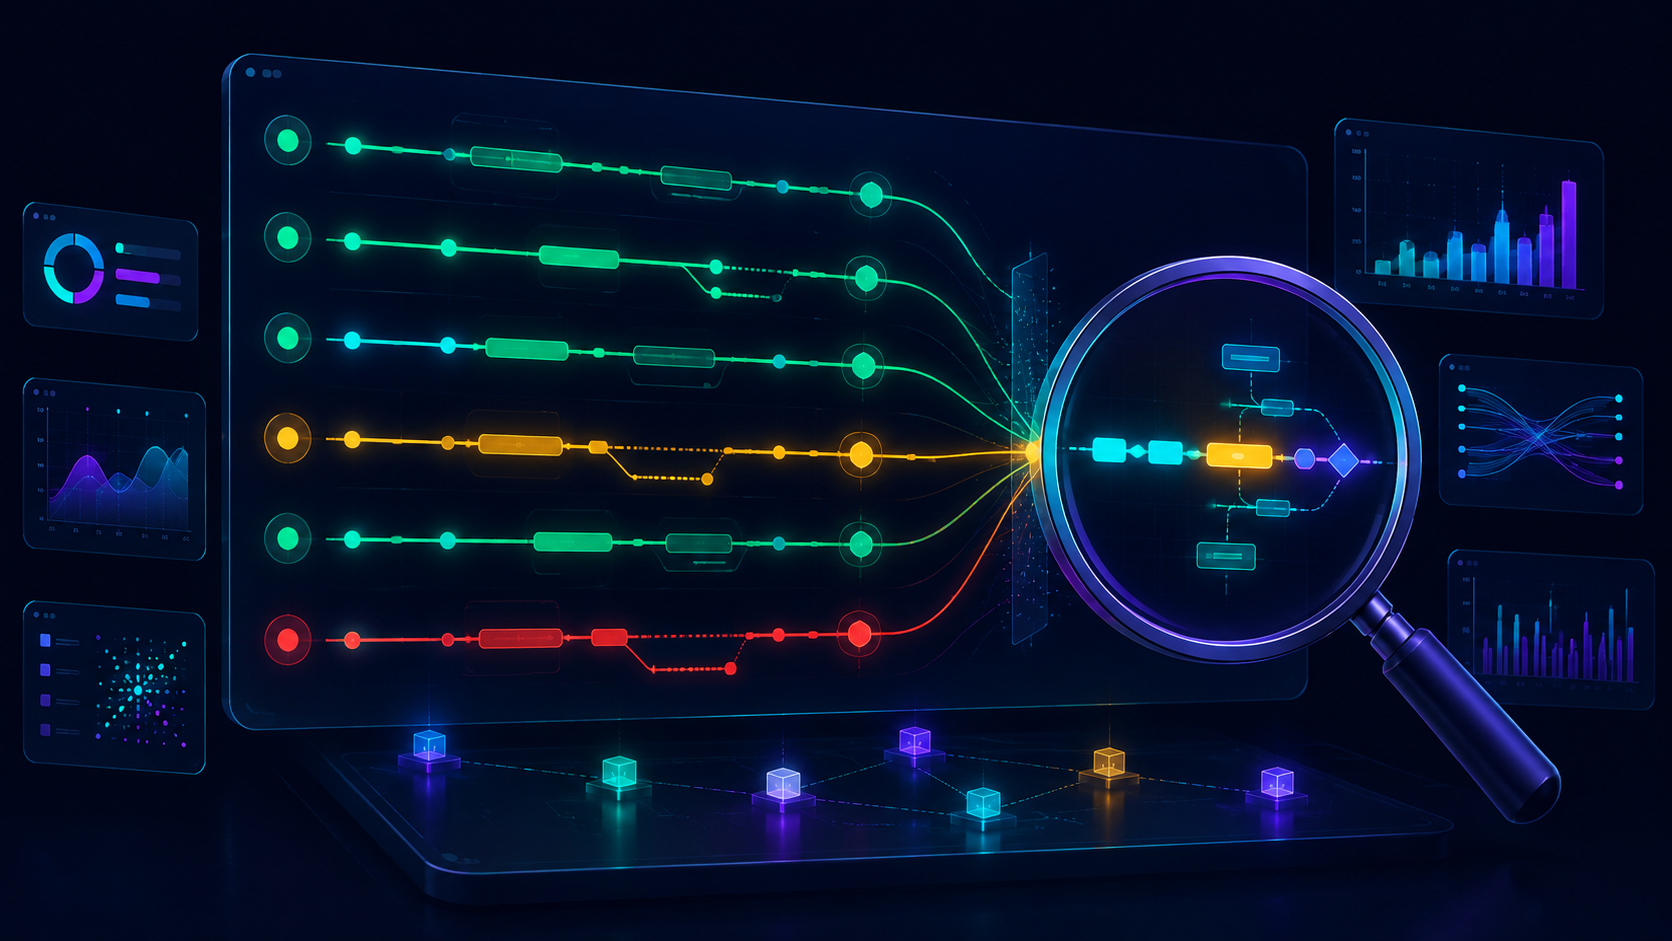
For two decades, the application observability story was settled. You instrumented your code with OpenTelemetry, sent traces to Datadog or New Relic, watched dashboards for latency spikes, and alerted on error rates. The failure modes were known — slow database queries, memory leaks, bad deployments — and the tooling matured around catching them.
Then AI agents shipped to production, and the dashboards started lying.
The agent looked healthy. Latency was normal. Error rate was zero. And yet the product was broken in ways no classic metric could detect. A tool call returned a perfectly valid response that was completely wrong. The model went into a confident hallucination that no exception handler ever caught. A reasoning loop quietly burned ten times the tokens it should have, costing real money without ever throwing an error.
This is the gap that AI agent observability fills. It is not a new branding for old tools — it is a different discipline aimed at a different class of failure. This article explains what changed, what you actually need to instrument, and how to build a pipeline that catches the failures classic APM was never designed to see.
Why Traditional APM Fails for Agents
Classic APM was built for deterministic systems. A function call either returned a value or threw an exception. The traces it captured answered classical questions: how long did this take, where in the call graph did it slow down, what error was raised.
Agents break every one of those assumptions.
Failures are semantic, not technical. A tool call that returns 200 OK with the wrong answer is invisible to APM. The HTTP layer is healthy. The system is broken anyway.
Latency hides cost. A 30-second response time is "slow" in classic APM. For an agent making twelve sequential LLM calls, it is also a $2 request that might have been a $0.20 request with better prompting.
Errors are silent. Models do not raise exceptions when they hallucinate. They produce confident, well-formed garbage. APM sees a successful response.
Causality is non-local. When an agent makes a wrong decision in step 7, the actual root cause might be the way step 2 framed the problem. Traces that capture only the failing span miss the actual bug.
Traditional APM tells you when the machine is broken. Agent observability tells you when the reasoning is broken.
That distinction is why every team that has shipped agents to production eventually concludes they need a second layer of observability on top of the classical one.
The Three Layers of Agent Observability
production agent has three layers, and each needs its own instrumentation strategy.
Layer 1: Infrastructure. This is the classical APM layer. Memory, CPU, network, container health. Datadog and New Relic still own this layer and do it well. Do not replace it — keep it.
Layer 2: LLM calls. This is where the new tooling lives. Every call to a model needs to capture the full prompt, the full response, the token counts, the latency, the cost, the model version, and the random seed if used. Without this layer, you cannot debug anything that happens above it.
Layer 3: Reasoning and tool use. This is the highest layer and the hardest to capture. The agent's planning steps, the decisions it made about which tools to call, the intermediate reasoning, the retry loops, the handoffs to other agents. This is where the actual product bugs live.
Most teams instrument layer 1, partially instrument layer 2, and ignore layer 3 entirely. The failures they then fail to detect are exactly the ones happening at layer 3.
Run Code from Your Browser - No Installation Required
What to Capture in Every Trace
A useful agent trace is fundamentally different from a useful HTTP trace. The fields you want are:
- The full session context — every message in the conversation, not just the failing one;
- The complete prompt sent to the model, including the system prompt, all tools available, and the full message history;
- The complete response from the model, including any reasoning traces if the model exposes them;
- The tool calls the model proposed and which were actually executed;
- The tool results that came back, including any errors or unexpected output;
- The cost — input tokens, output tokens, reasoning tokens, and the dollar equivalent;
- The latency broken down into time-to-first-token, total generation time, and tool-call overhead;
- The model identity — provider, model name, version, and any sampling parameters used;
- The user feedback signal if one exists — thumbs up/down, abandonment, follow-up corrections. Skip any of those and you will eventually be debugging blind. The cost of capturing all of them at scale is real, which is why production teams sample aggressively — but the schema needs to be complete even when the sampling rate is low.
Run Code from Your Browser - No Installation Required
Evals: The Other Half of Observability
Traces tell you what happened. Evals tell you whether it was good.
This is the second half of agent observability that classic APM never had. Because correctness is semantic, you cannot detect it with metrics alone — you need a separate evaluation system that scores agent outputs against criteria you define.
The patterns that work in production:
- LLM-as-judge evals. Use a strong model to grade the outputs of your production model. Slow and expensive, but the only realistic way to evaluate quality at scale;
- Rule-based evals. Deterministic checks against your output — does it contain the required fields, is the JSON valid, does it cite real sources;
- Embedding-based evals. Compare agent outputs against reference answers using semantic similarity, useful for soft-graded tasks like summarization;
- Human-in-the-loop evals. A small percentage of production traffic gets flagged for human review, with the resulting labels feeding back into your dataset. The best teams combine all four and treat the eval suite as a first-class part of the agent codebase, with the same versioning and CI discipline as production code.
Without evals, every production change is a gamble. With evals, every production change is a measured experiment.
That mental shift is the difference between teams that ship agents safely and teams that ship them and pray.
Tools You Will Actually Use
The ecosystem in 2026 is busy but the landscape has consolidated. The tools you will encounter most:
- LangSmith — the commercial platform from the LangChain team. Best framework integration, strong eval tooling. The default for LangGraph applications;
- Langfuse — the leading open-source alternative. Self-hostable, ClickHouse-backed, with most of the same capabilities as LangSmith;
- Arize Phoenix — open-source with ML-grade eval rigor. Strong for teams that already do classical ML monitoring;
- MLflow — Apache 2.0, governed by the Linux Foundation. Increasingly the choice for teams that want a fully open stack;
- Datadog LLM Observability — the natural choice for shops already invested in Datadog. Integrates the new traces with the existing infrastructure layer;
- OpenTelemetry GenAI semantic conventions — not a tool but a standard. The OTel community now publishes conventions specifically for LLM and agent traces, so your data is portable across platforms. Pick one based on what you already use. The capabilities have converged enough that the integration story matters more than the feature checklist.
Start Learning Coding today and boost your Career Potential
Start Learning Coding today and boost your Career Potential
Building Your First Observability Pipeline
The minimum viable agent observability pipeline has three parts:
- Instrumentation. Wrap your LLM calls and tool calls with tracing. Capture the full schema described above, not a stripped-down version. This is the single highest-value action you can take and the one teams most often skimp on;
- A trace destination. Pick one of the platforms above and send your traces there. Start with the simplest setup that captures everything, even if you do not look at the dashboards yet;
- An eval loop. Build a small dataset of representative inputs and expected behaviors. Run your evals on every meaningful change. Wire failed evals to alerting. Once those three are in place, you have a foundation that scales. The advanced capabilities — drift detection, regression tests on prompts, A/B testing of model versions, automated dataset growth from production traces — all build on this same foundation.
A common mistake is to treat observability as something you add after the agent is in production. By the time you realize you need it, the failures have already shipped. The right time to add observability is before your first user sees the agent — not after.
Conclusion
AI agent observability is not an extension of classic APM. It is a different discipline solving a different problem, and the teams shipping reliable agents in 2026 are the ones who internalized that early.
The practical takeaway is simple. Instrument your traces fully, evaluate your outputs continuously, and treat both as first-class engineering artifacts. The cost of doing this from day one is small. The cost of skipping it and trying to retrofit it after a production incident is enormous.
An agent without observability is a black box that ships its bugs straight to users.
That is the kind of thing you only learn the expensive way once.
FAQ
Q: Why can't I just use my existing APM tool for agents?
A: Classic APM is built to detect deterministic failures — errors, timeouts, resource exhaustion. It cannot detect semantic failures like hallucinations, wrong-but-plausible tool calls, or runaway reasoning loops. Those are the failures that matter for agents.
Q: Do I need both LangSmith (or similar) and Datadog?
A: Usually yes. They cover different layers. Datadog or its equivalent monitors infrastructure. LangSmith or its equivalent monitors agent behavior. Most production teams run both.
Q: How much does agent observability cost?
A: It depends on volume and provider. Free open-source self-hosted options exist (Langfuse, MLflow, Arize Phoenix). Commercial tiers start around $100/month for small teams and scale with trace volume. Build the open-source path first if cost is a constraint.
Q: Should I store full prompts and responses for every trace?
A: Yes during development and beta, possibly sampled in production. Storage is cheap; debugging a failure without the full context is expensive. Use retention policies to manage costs over time.
Q: How do evals fit into CI/CD?
A: Treat evals like tests. Run your full eval suite on every prompt or model change. Block deployment if eval scores drop below a threshold. This is the closest thing to a unit-test discipline that exists for LLM applications.
Q: What is the single highest-value thing to instrument first?
A: Full prompts and full responses for every LLM call, with timestamps and cost. Almost every other debugging task starts there.
Q: Can I use OpenTelemetry for agent traces?
A: Yes. The OpenTelemetry GenAI semantic conventions are now mature enough for production use. They keep your trace format portable across vendors, which matters as the tooling landscape evolves.
Was dit artikel nuttig?
Delen:
Was dit artikel nuttig?
Delen:
Gerelateerde cursussen
Bekijk Alle CursussenBeginner
Creating Custom AI Agents with Anthropic Claude
Learn how to create a fully functional MCP (Model Context Protocol) server to integrate AI models like Claude with real-world tools like Excel. Everything from core concepts to setting up your development environment and building your first working server that can analyze real data through natural language prompts. No advanced programming knowledge required, just curiosity and willingness to explore AI automation.
Beginner
Observability Fundamentals in DevOps
A beginner-friendly course introducing the essential concepts and practical applications of observability in DevOps. Learn how logs, metrics, and traces provide visibility into systems, how to use dashboards and alerts, and how to interpret service health using SLIs and SLOs. Each chapter combines clear explanations with real-world text-based examples to build foundational skills for modern DevOps workflows.
Beginner
Effective Logging Strategies
Master the art and science of logging for robust, maintainable, and observable software systems. This course guides software engineers and DevOps professionals through the principles, patterns, and practical tools needed to design and implement effective logging strategies in modern environments.
A2A Protocol
How AI Agents Talk to Each Other
by Daniil Lypenets
Full Stack Developer
May, 2026・13 min read
Model Context Protocol (MCP): The USB-C of AI Agents
How One Protocol Became the Standard for Connecting AI to Everything
by Daniil Lypenets
Full Stack Developer
May, 2026・15 min read
Inhoud van dit artikel
