Excel for Beginners
Course
9478 Learners Already enrolled4.8
(238)
- Master the essentials of Excel, including navigation, formatting, and data manipulation.
- Gain expertise in using Excel functions and formulas, such as SUM, AVERAGE, and IF statements.
- Understand how to create and customize charts and graphs to visually represent data.
- Learn to use advanced data aggregation tools to efficiently summarize and analyze large datasets.
Equip your business with cutting-edge Data and AI expertise.


Share it on social media and in your performance review
There are 7 modules in this course
Dive into the world of Excel with this comprehensive video course, designed to take you from basic navigation to mastering functions and basic data analysis. Starting with foundational skills like data entry and cell formatting, you'll quickly progress to using powerful tools. Whether you're organizing large datasets, performing statistical analysis, or creating dynamic charts, this course equips you with the practical skills needed in today’s data-driven environment.- Sorting Data in ExcelPreview
- Filtering Data Using AutoFilterPreview
- Clearing and Reapplying Filters in ExcelPreview
- Excel Rules and Advanced Search TechniquesPreview
- Creating and Managing Tables in ExcelPreview
- Excel Table Styles and Quick FormattingPreview
- Using Excel Table ToolsPreview
- Quiz: Excel Data Management & AnalysisPreview
- Excel Chart TypesPreview
- Creating a Basic Chart in ExcelPreview
- Customizing Excel Chart ElementsPreview
- Changing Chart Styles and Colors in ExcelPreview
- Adding and Removing Chart ElementsPreview
- Editing Chart Data in ExcelPreview
- Adding Trendlines to Excel ChartsPreview
- Quiz: Excel Data VisualizationPreview
- Managing Excel Worksheets: Add, Delete, Rename, and RearrangePreview
- Grouping and Ungrouping Worksheets in ExcelPreview
- Using the Format Painter in ExcelPreview
- Inserting and Deleting Columns, Rows, and Cells in ExcelPreview
- Hiding and Unhiding Columns and Rows in ExcelPreview
- Saving Workbooks in ExcelPreview
- Opening and Closing WorkbooksPreview
- Protecting Excel Workbooks with PasswordsPreview
- Using Excel TemplatesPreview
- Quiz: Managing Excel WorkbooksPreview
- SummaryPreview
Chosen by students of top schools


Why people choose Codefinity for their career
Kwizera Mugisha
The teaching methodology at Codefinity is excellent, and I particularly appreciate how it has prepared me to handle real-world coding problems. Currently, I am delving into Node.js and eagerly anticipate building full-stack projects that integrate all the knowledge I have gained.
Sherry Barnes-Fox
My first course was 4 hours, I did it in a few days, "nugget-style. The instructions are very clear and easy to understand. There is even a hint to help you get the answer, and if you still cannot get the answer, then you can display the answer. I love the learning style that is used, it engages me.
Bill Wagner
I have really liked the browser-based lessons that allow me to code within the lesson. The RUN button allows me to test the code I write before submitting for a grade.
Stephanie Chan
As I went through the first course of the Python track, I liked the way the course was lay out (in easy and digestible modules) with little exercises at the end of each concept.
Daniel Chinea
I have gained a lot of practical and logical thinking skills, along with patience for myself and confidence in myself that I can learn programming.
Steve Bruening
The learning was progressive and made it easy to follow along and make progress. I could feel my skills increasing and building on each other as the course went along.
Learner reviews
4.8
50 reviews
5
84%
4
14%
3
2%
2
0%
1
0%
Showing 3 of 50 reviews
5
Reviewed on May 6, 2025
The video helps to keep engaged on the learning. The demonstrations make it easy to comprehend the content.
Mary
3
Reviewed on May 4, 2025
The excel version in the workbook needs to be updated to the newer version since the instructor is using the newer version. Some exercises are not as easily completed with the older version.
5
Reviewed on May 3, 2025
So far so good. Its easy to understand and paced well.
Recommended if you're interested in learningExcel


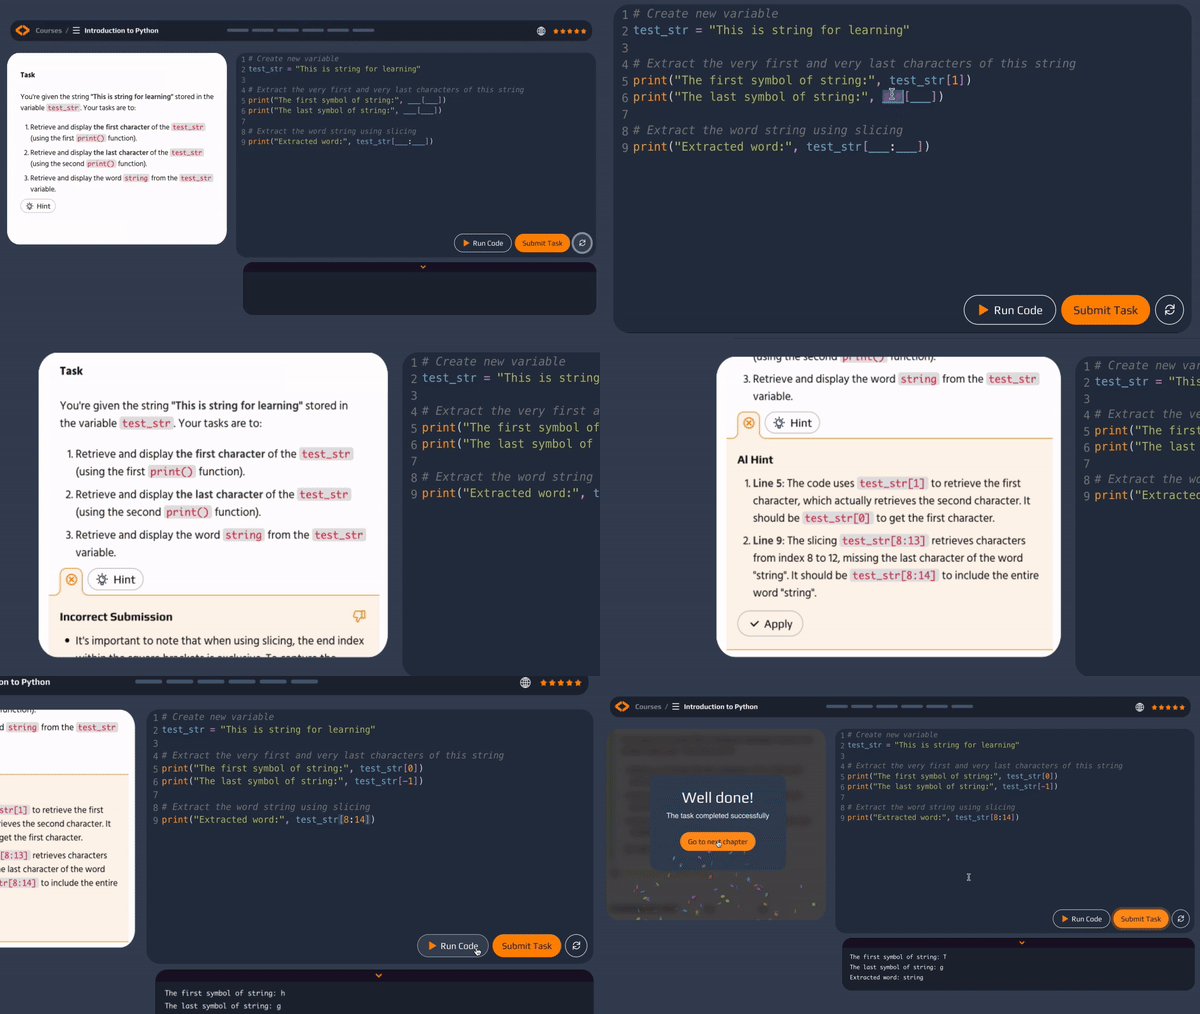
Embrace the fascination of Tech Skills! Our AI-assistant provides real-time feedback, personalized hints, and error explanations, empowering you to learn with confidence.
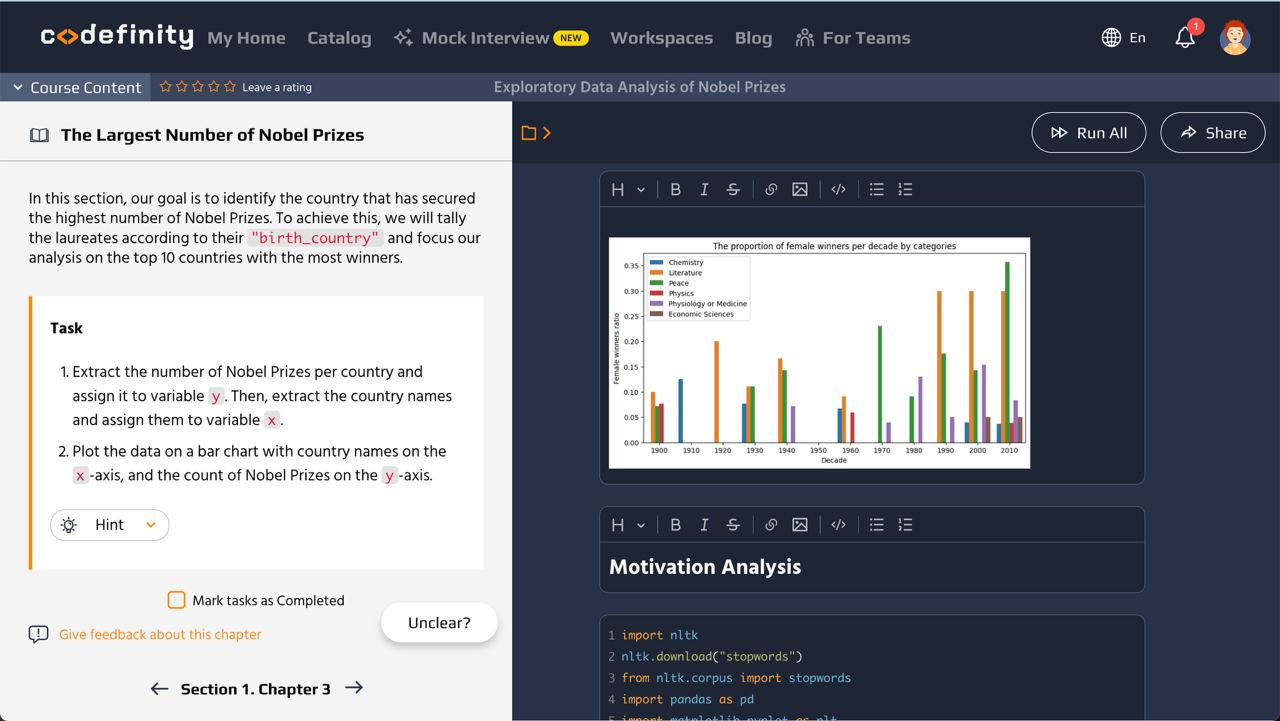
With Workspaces, you can create and share projects directly on our platform. We've prepared templates for your convenience
Take control of your career development and commence your path into mastering the latest technologies
Real-world projects elevate your portfolio, showcasing practical skills to impress potential employers


Full catalog access
One subscription opens up this course and our entire catalog of projects and skills.Your subscription also includes:


Frequently asked questions
Still have questions?
Write your question here