Related courses
See All CoursesIntermediate
Probability Theory Basics
Probability theory is a fundamental branch of mathematics that deals with the study of uncertainty and randomness. It provides a framework for understanding and quantifying uncertainty in various fields, including statistics, data analysis, machine learning, finance, physics, and more.
Advanced
Advanced Probability Theory
Statistics and probability theory are fundamental tools in data analysis, decision-making, and scientific research. They provide a systematic and quantitative way to understand and interpret data, make predictions, and draw conclusions based on evidence. Now we will consider all additional topics necessary for Data Science and Data Analytics.
Intermediate
The Art of A/B Testing
This course is a comprehensive and practical online program designed to equip individuals with the knowledge and skills necessary to conduct effective A/B tests. In this course, participants will learn the fundamental principles of A/B testing, including experimental design, sample size determination, hypothesis testing, and statistical analysis.
What is p-value
p-value
by Andrii Chornyi
Data Scientist, ML Engineer
Dec, 2023・
7 min read

Introduction
In the field of statistics and data analysis, the concept of the p-value plays a central role in hypothesis testing and decision-making. Understanding what a p-value is and how to interpret it is crucial for anyone involved in statistical analysis or research.
Purpose of p-value
- Objective Assessment: The p-value offers an objective measure to help decide whether to reject the null hypothesis in statistical hypothesis testing.
- Quantifying Evidence: It quantifies the strength of the evidence against the null hypothesis.
What Exactly is p-value?
- Definition: The p-value is the probability of obtaining test results at least as extreme as the results observed during the test, assuming that the null hypothesis is correct.
- Statistical Significance: A p-value helps determine the statistical significance of the test results. It measures the probability of observing the given result, or one more extreme, by chance alone.
Run Code from Your Browser - No Installation Required

How to Interpret p-value
- Low p-value (< 0.05): A low p-value suggests that the observed data are unlikely under the null hypothesis. It is often used as a threshold for rejecting the null hypothesis.
- High p-value (≥ 0.05): A high p-value indicates that the observed data are likely under the null hypothesis, and there is insufficient evidence to reject it.
Example
Let's consider a simple example to illustrate the concept of the p-value in a real-world scenario:
Scenario: Drug Efficacy Test
Suppose a pharmaceutical company has developed a new drug intended to lower blood pressure. To test the efficacy of this drug, a randomized controlled trial is conducted.
Null Hypothesis (H0)
The null hypothesis (H0) in this study is that the new drug has no effect on lowering blood pressure, meaning any observed effect in the trial is due to chance.
Experiment
100 patients are randomly divided into two groups:
- Group A (50 patients) receives the new drug.
- Group B (50 patients) receives a placebo.
After a specified period, the average decrease in blood pressure is measured in both groups.
Observed Data
- Average decrease in Group A (drug): 8 mmHg
- Average decrease in Group B (placebo): 2 mmHg
Statistical Test
A statistical test (e.g., a t-test) is conducted to determine whether the difference in blood pressure reduction between the two groups is significant.
Calculating the p-value
The test calculates a p-value of 0.03. This p-value represents the probability of observing a difference in blood pressure reduction of 6 mmHg (or more extreme) between the drug and placebo groups if, in reality, the drug had no effect (i.e., under the null hypothesis).
Statistical Significance
- Interpreting the p-value: Since the p-value (0.03) is less than the conventional threshold of 0.05, the result is considered statistically significant. This means that the observed difference in blood pressure reduction is unlikely to have occurred by chance alone.
- Implication: With such a result, the researchers may reject the null hypothesis and conclude that there is sufficient evidence to suggest that the drug is effective in lowering blood pressure.
- Cautions: It's important to note that while the p-value can suggest that the drug is effective compared to the placebo, it doesn't quantify how effective the drug is. Additionally, the p-value does not tell us the probability that the null hypothesis is true or false; it only indicates the compatibility of the observed data with the null hypothesis.
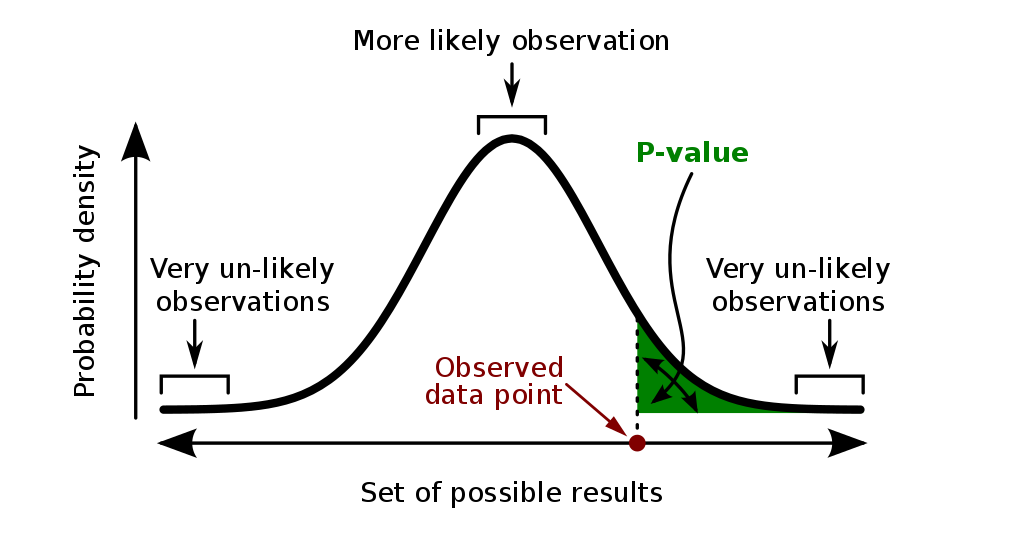
Geometric Representation of p-value
- Area Under Curve: In a statistical distribution, the p-value can be represented as the area under the probability density curve of the test statistic. For a normal distribution, it is the area in the tails beyond the observed test statistic value.
- Graphical Interpretation: The graphical representation helps in visualizing the p-value as the probability of observing more extreme outcomes than the test statistic.
Start Learning Coding today and boost your Career Potential
Misconceptions and Limitations
- Not the Probability of Null Hypothesis: The p-value does not represent the probability of the null hypothesis being true.
- Dependent on Sample Size: The p-value can be influenced by the sample size; larger samples can produce small p-values even for small effect sizes.
- Threshold Arbitrariness: The commonly used threshold (such as 0.05) for determining statistical significance is arbitrary and should not be the sole factor in decision-making.
Best Practices in Using p-value
- Contextual Interpretation: Always interpret p-values in the context of the study, including its design, data quality, and real-world significance.
- Combine with Effect Size: Consider the effect size alongside the p-value to understand the practical significance of the results.
- Avoid p-hacking: Be cautious of practices like p-hacking, where data is manipulated to achieve a desirable p-value.
Conclusion
The p-value is a fundamental concept in statistical hypothesis testing, providing a quantifiable measure to assess the evidence against a null hypothesis. Its correct interpretation, considering the context and limitations, is vital in making informed and reliable conclusions in statistical analysis.
FAQs
Q: Can we say a hypothesis is true if the p-value is low?
A: No, a low p-value only suggests that the data are unlikely under the null hypothesis. It does not prove the hypothesis to be true.
Q: Is a p-value of 0.05 always the cut-off for significance?
A: While 0.05 is commonly used, the cut-off for significance can vary based on the field of study and the specific research context.
Q: Can a high p-value mean the null hypothesis is true?
A: A high p-value indicates that the data do not provide strong evidence against the null hypothesis, but it does not prove the null hypothesis to be true.
Q: What does a p-value of 1 mean?
A: A p-value of 1 suggests that the observed data perfectly align with the expected results under the null hypothesis.
Q: How does sample size affect the p-value?
A: Larger sample sizes can detect smaller differences and thus may yield smaller p-values, sometimes highlighting effects that might not be practically significant.
Was this article helpful?
Share:
Was this article helpful?
Share:
Related courses
See All CoursesIntermediate
Probability Theory Basics
Probability theory is a fundamental branch of mathematics that deals with the study of uncertainty and randomness. It provides a framework for understanding and quantifying uncertainty in various fields, including statistics, data analysis, machine learning, finance, physics, and more.
Advanced
Advanced Probability Theory
Statistics and probability theory are fundamental tools in data analysis, decision-making, and scientific research. They provide a systematic and quantitative way to understand and interpret data, make predictions, and draw conclusions based on evidence. Now we will consider all additional topics necessary for Data Science and Data Analytics.
Intermediate
The Art of A/B Testing
This course is a comprehensive and practical online program designed to equip individuals with the knowledge and skills necessary to conduct effective A/B tests. In this course, participants will learn the fundamental principles of A/B testing, including experimental design, sample size determination, hypothesis testing, and statistical analysis.
Content of this article
